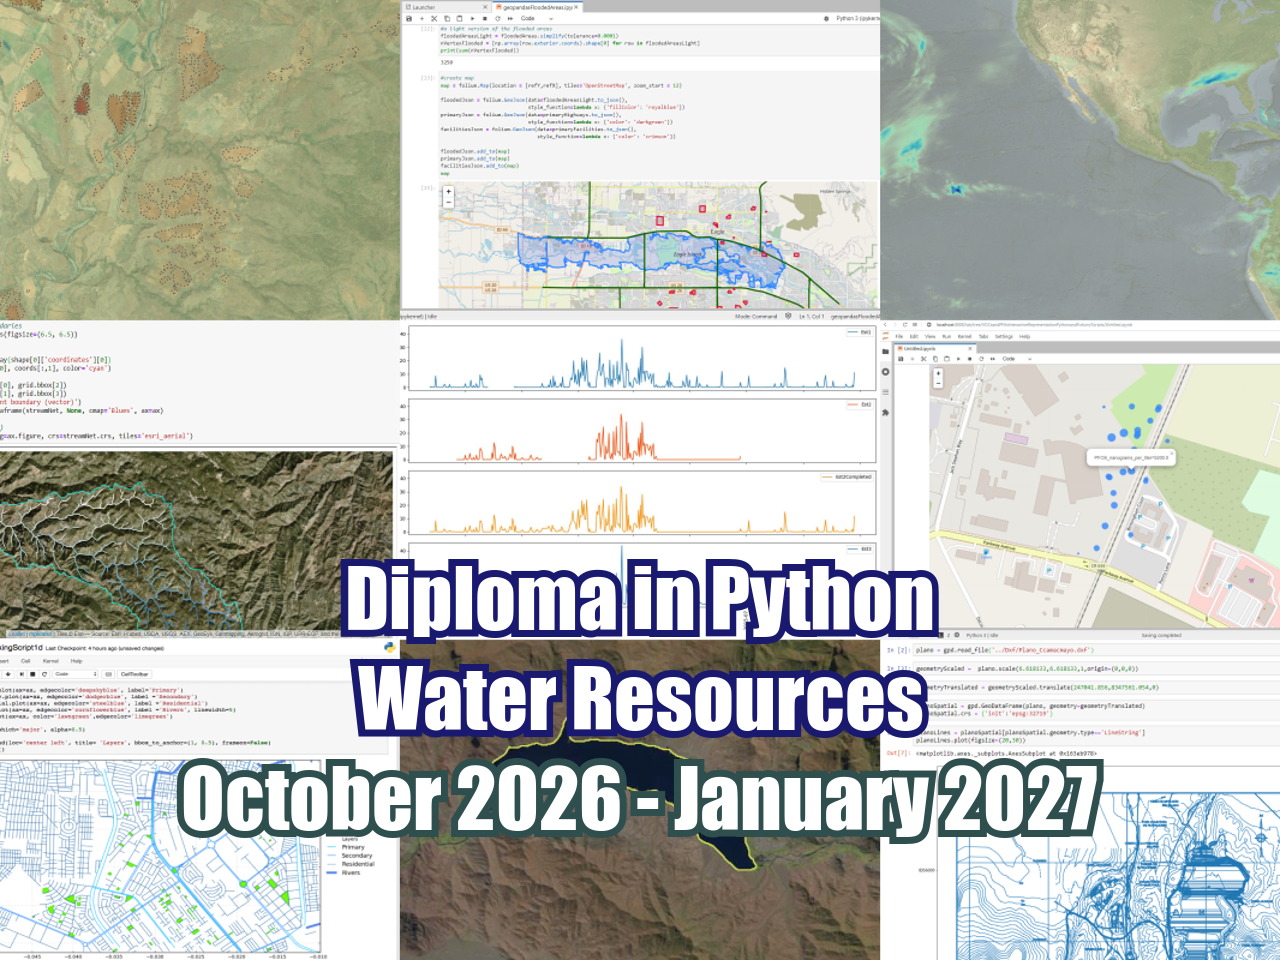
Performance analysis of Open Drone Map to process hundreds of drone images
/
Drone imagery allow us to have terrain orthophotos and elevation models for a reasonable price and high accuracy with a minor influence of clouds or dust when compared to satellite imagery. But, we believe that drone types and drone imagery processing software were designed for the local scale and the suitability for regional scale remain uncertain.
In water resources engineering and environmental studies, orthophotos and elevation models generated from drone imagery are of particular interest for the determination of the main surface features related to the surface / groundwater flow and the interaction with the ecosystem, but these images need to be on regional scale (>1km2).
So far, OpenDroneMap (https://github.com/OpenDroneMap/ODM/) is a strong open source alternative for the processing of drone imagery. The software is a compilation of different tools for the image / point cloud / mesh / raster processing and analysis as Gdal, OpenSfm, OpenCV, Pdal and many others; due to all of its dependencies OpenDroneMap runs better on a virtualization enviroment as Docker. Almost all the image processing tools are implemented in OpenDroneMap with options to generate geospatial pointclouds, ortophotos and elevation models among other spatial data from the processing stage.
We have done a recursive analysis over a set of aerial photos on a standard desktop computer to have a panorama of the rates and trends from OpenDroneMap in the computation of different amount of images. Although the rates and trends apply only for a specific dataset and computer configuration, this study can to be taken as a reference for the computational time and as a perspective of how the software works with great amount of data.
Datasets and computer configuration
For this analysis we have used the “Adobe Buttes – Delta, Colorado” dataset from the Drone Mapper sample data available on this link:
https://dronemapper.com/sample_data/
The system configuration for the computer used for the analysis is:
Architecture: x86_64
CPU(s): 8
Model name: Intel(R) Core(TM) i7-4790 CPU @ 3.60GHz
CPU MHz: 3899.047
The selected operating system for this analysis was Debian GNU/Linux 9.8 (stretch) and OpenDroneMap was run under Docker.
Input data
The dataset actually consists of two flights that gives a total 531 images that were divided into subgroups of 50 images. The sample dataset has a size of 2.8 Gb with images sizes of 5.6 - 6.0 mb.
A preview of the spatial location from the drone camera and the resulting orthophoto can be seen in the following figures for a group of 100 images and for the complete dataset (531 images).

100 images
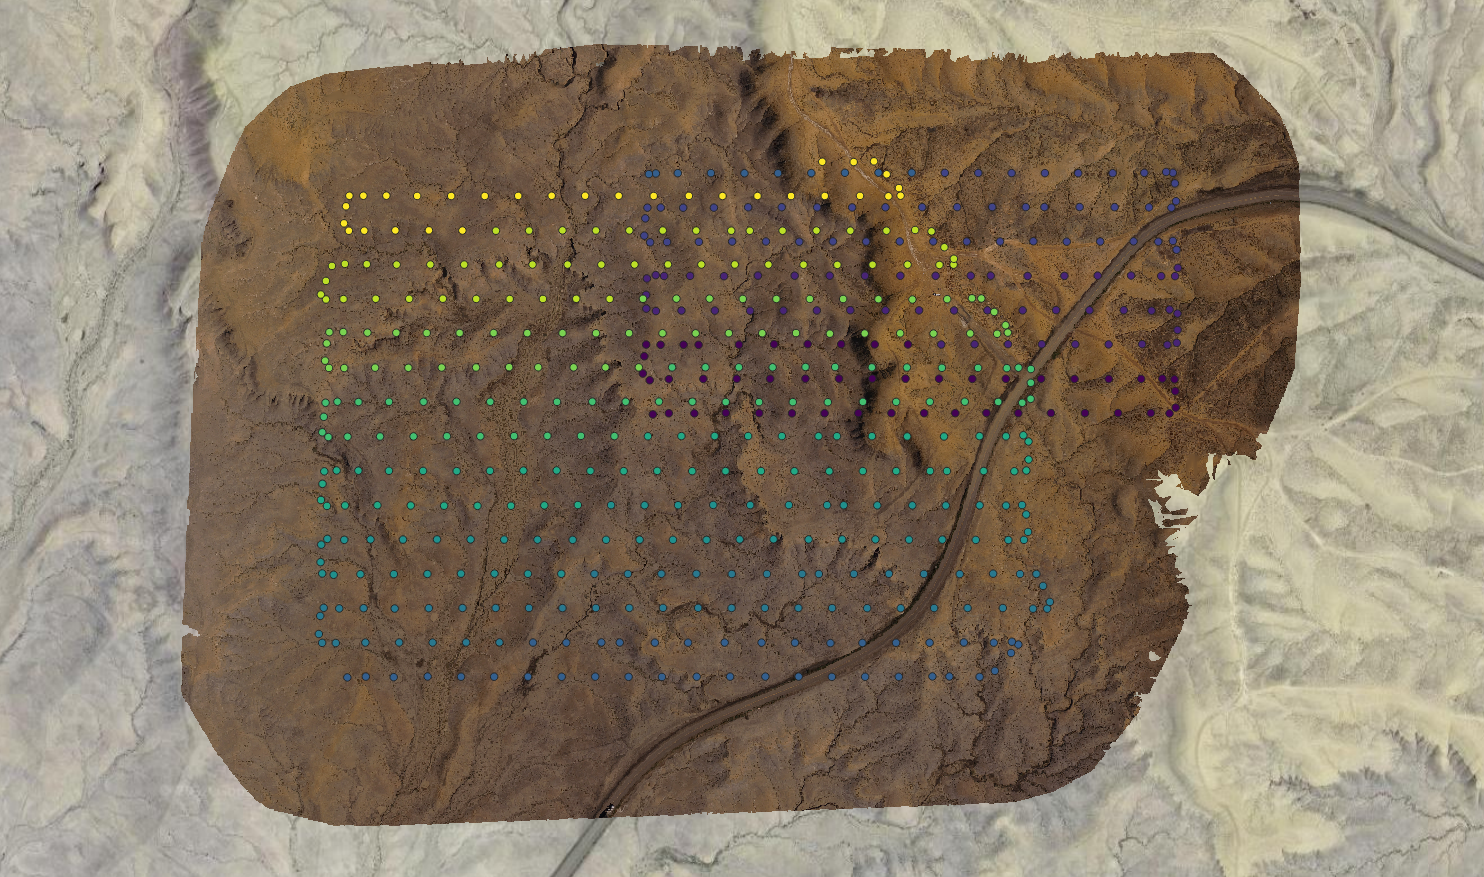
531 images
A sample of the Linux commands to store the date and Docker commands to run OpenDroneMap can be seen on the following text:
date > outputData/images400start.log docker run --rm -v "$(pwd)/inputImages/images400:/code/images" -v "$(pwd)/outputData/odm_georeferencing400:/code/odm_georeferencing" -v "$(pwd)/outputData/odm_orthophoto400:/code/odm_orthophoto" opendronemap/opendronemapdate > outputData/images400end.logPerformance analysis
The start and finish time of OpenDroneMap processing was recorded and processed with Python. The complete set of calculation time, image number and total image size can be seen in the following table:

Simulation time ranges for 0.4 hour for 50 images with a total image size of 290 Mb to 5.47 hours for 500 images with a total size of 2890Mb. A linear regression analysis was performed for the resulting dataset, on the following picture the image number vs computational time are plotted together with the regression line and regression equation.

It can be seen that the computational time do not follow a strict linear dependency with the number of images. High amount of images takes more time to process than the linear trend.
In order to have a better sense of the increasing rates of processing times we have separated the regression lines into three parts as it can be seen on this figure:

For the upper group of images, the rate of increase of computational time is 30% above the average for all points and 65% higher that for the lower third of samples.
This trend on the image processing with OpenDroneMap poses some questions about software performance for thousands of images. There are alternatives as clustering images by location and perform analysis by clusters, in our experience the computational time decreases but the differential distance in overlapping resulting images is above the 1 meter, therefore more research have to done to ensure image processing on a regional scale with adequate computational times.