A Python class for crop line recognition with Rasterio and Scikit Image - Tutorial
/The use of Python classes is a level of abstraction that allows us to store functions and variables in an effective way. With a Python class we can modify/repeat our analysis in Python without much effort.
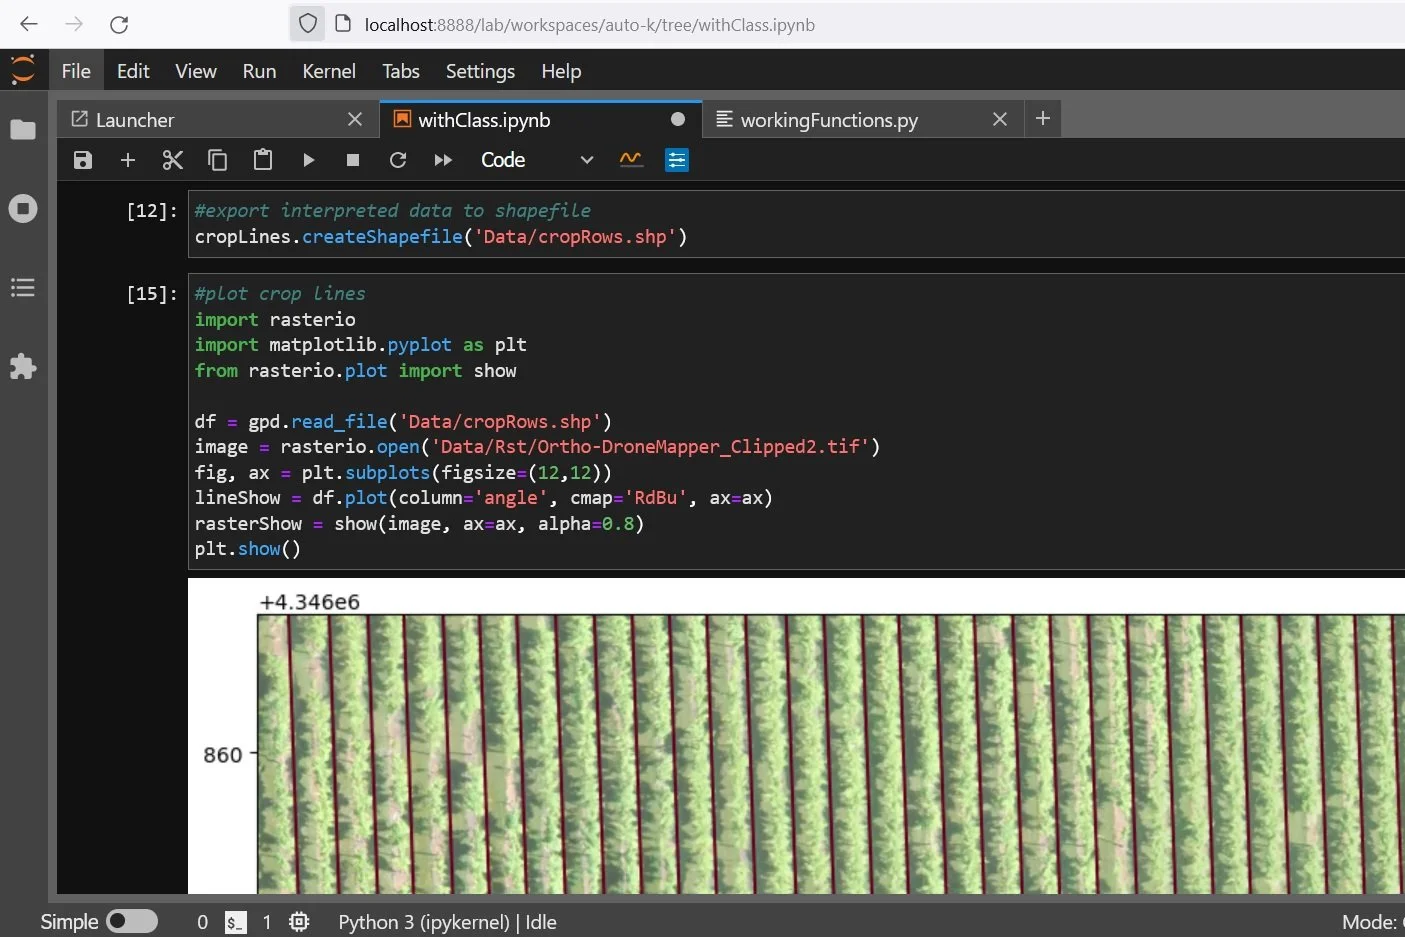
We have done an applied example of crop line recognition using a Python class. The procedure uses a drone orthophoto and a shapefile of an area of interest, has options for the filter and creates a shapefile from the recognized lines.
Tutorial
from workingFunctions import cropRecognition
import geopandas as gpd
# create a crop recognition object
cropLines = cropRecognition('Data/Rst/Ortho-DroneMapper_Clipped2.tif')# refine band red=1 green=2 blue=3
cropLines.band = 2#plot selected band
cropLines.plotBand()#define canny filter sigma to represent
cropLines.cannyMin, cropLines.cannyMean, cropLines.cannyMax = 4,5,6 #1,2,3#display different canny filters
cropLines.cannyFilterDisplay()#define selected canny filter
cropLines.cannySigma = 6#show canny filter array
cropLines.cannyFilterarray([[False, False, False, ..., False, False, False],
[False, False, False, ..., False, False, False],
[False, False, False, ..., False, False, False],
...,
[False, False, False, ..., False, False, False],
[False, False, False, ..., False, False, False],
[False, False, False, ..., False, False, False]])#perform hough transform for crop line recornition
cropLines.displayHoughTransform()#define the geometry of the area of interest
aoi = gpd.read_file('Data/Shp/aoi.shp')
cropLines.aoiGeom = aoi.iloc[0].geometry
cropLines.aoiGeom#create lines in the area of interest extension
cropLines.linesToAoi()#export interpreted data to shapefile
cropLines.createShapefile('Data/cropRows.shp')#plot crop lines
import rasterio
import matplotlib.pyplot as plt
from rasterio.plot import show
df = gpd.read_file('Data/cropRows.shp')
image = rasterio.open('Data/Rst/Ortho-DroneMapper_Clipped2.tif')
fig, ax = plt.subplots(figsize=(12,8))
lineShow = df.plot(column='angle', cmap='RdBu', ax=ax)
rasterShow = show(image, ax=ax, alpha=0.5)
plt.show()


