Arid Zone Determination on Global Scale with IMERG Imagery and QGIS 3 - Tutorial
/An arid region is defined as a land that has little to no rain and it is too dry to support extensive vegetation. Arid regions are common in our planet and those are located on specific latitudes as a product from the atmospheric global circulation, topography and other factors. Even tough arid regions are too dry, it doesn't mean that an extensive amount of people do live in these arid regions or their economical activities depend on those areas.
As zones located close to rivers are vulnerable to flooding, the arid zones and its water resources are vulnerable to global warming. Changes on the spatial and temporal precipitation distribution with an increase on temperature can lead to drastic changes on the surface flow rates and the groundwater flow regime.
As a deeper introduction to the existence of arid regions, there is a animation from the NASA's Global Precipitation Measurement mission that unifies the precipitation measurements of 12 satellites and integrates them into a Integrated Multisatellite Retrievals for GPM data product (IMERG). The animated data visualization is from April though September 2014 and shows the global distribution of precipitation as rain (liquid) or snow (frozen).
Precipitation distribution follow some circulation paths related to the Hadley Cells and Ferrel Cells and those are highly influenced by the Coriolis effect. Arid regions do originate on the border in between the Ferrel Cell and Hadley Cells where both cells have an descending behavior while the humid regions originate on cell borders where cells have both a ascending behavior.
Global circulation cells (source: metoffice.gov.uk)
It can be concluded that arid regions are inherent to the global circulation system and any changes in the global circulation will impact the water availability in those areas.
Aridity index
This tutorial has the objective to delineate the arid zones on a global scale by the use of the IMERG imagery and open source GIS software as QGIS. For the purpose of arid determination we have chosen the Aridity Index (AI) from the World Atlas of Desertification (United Nations Environment Programme 1997) where they classify the arid condition based on the mean annual precipitation (P) and the mean annual potential evapotranspiration (PET) as:
AI = P/PET
Based on the AI value, various degrees of aridity can be defined:
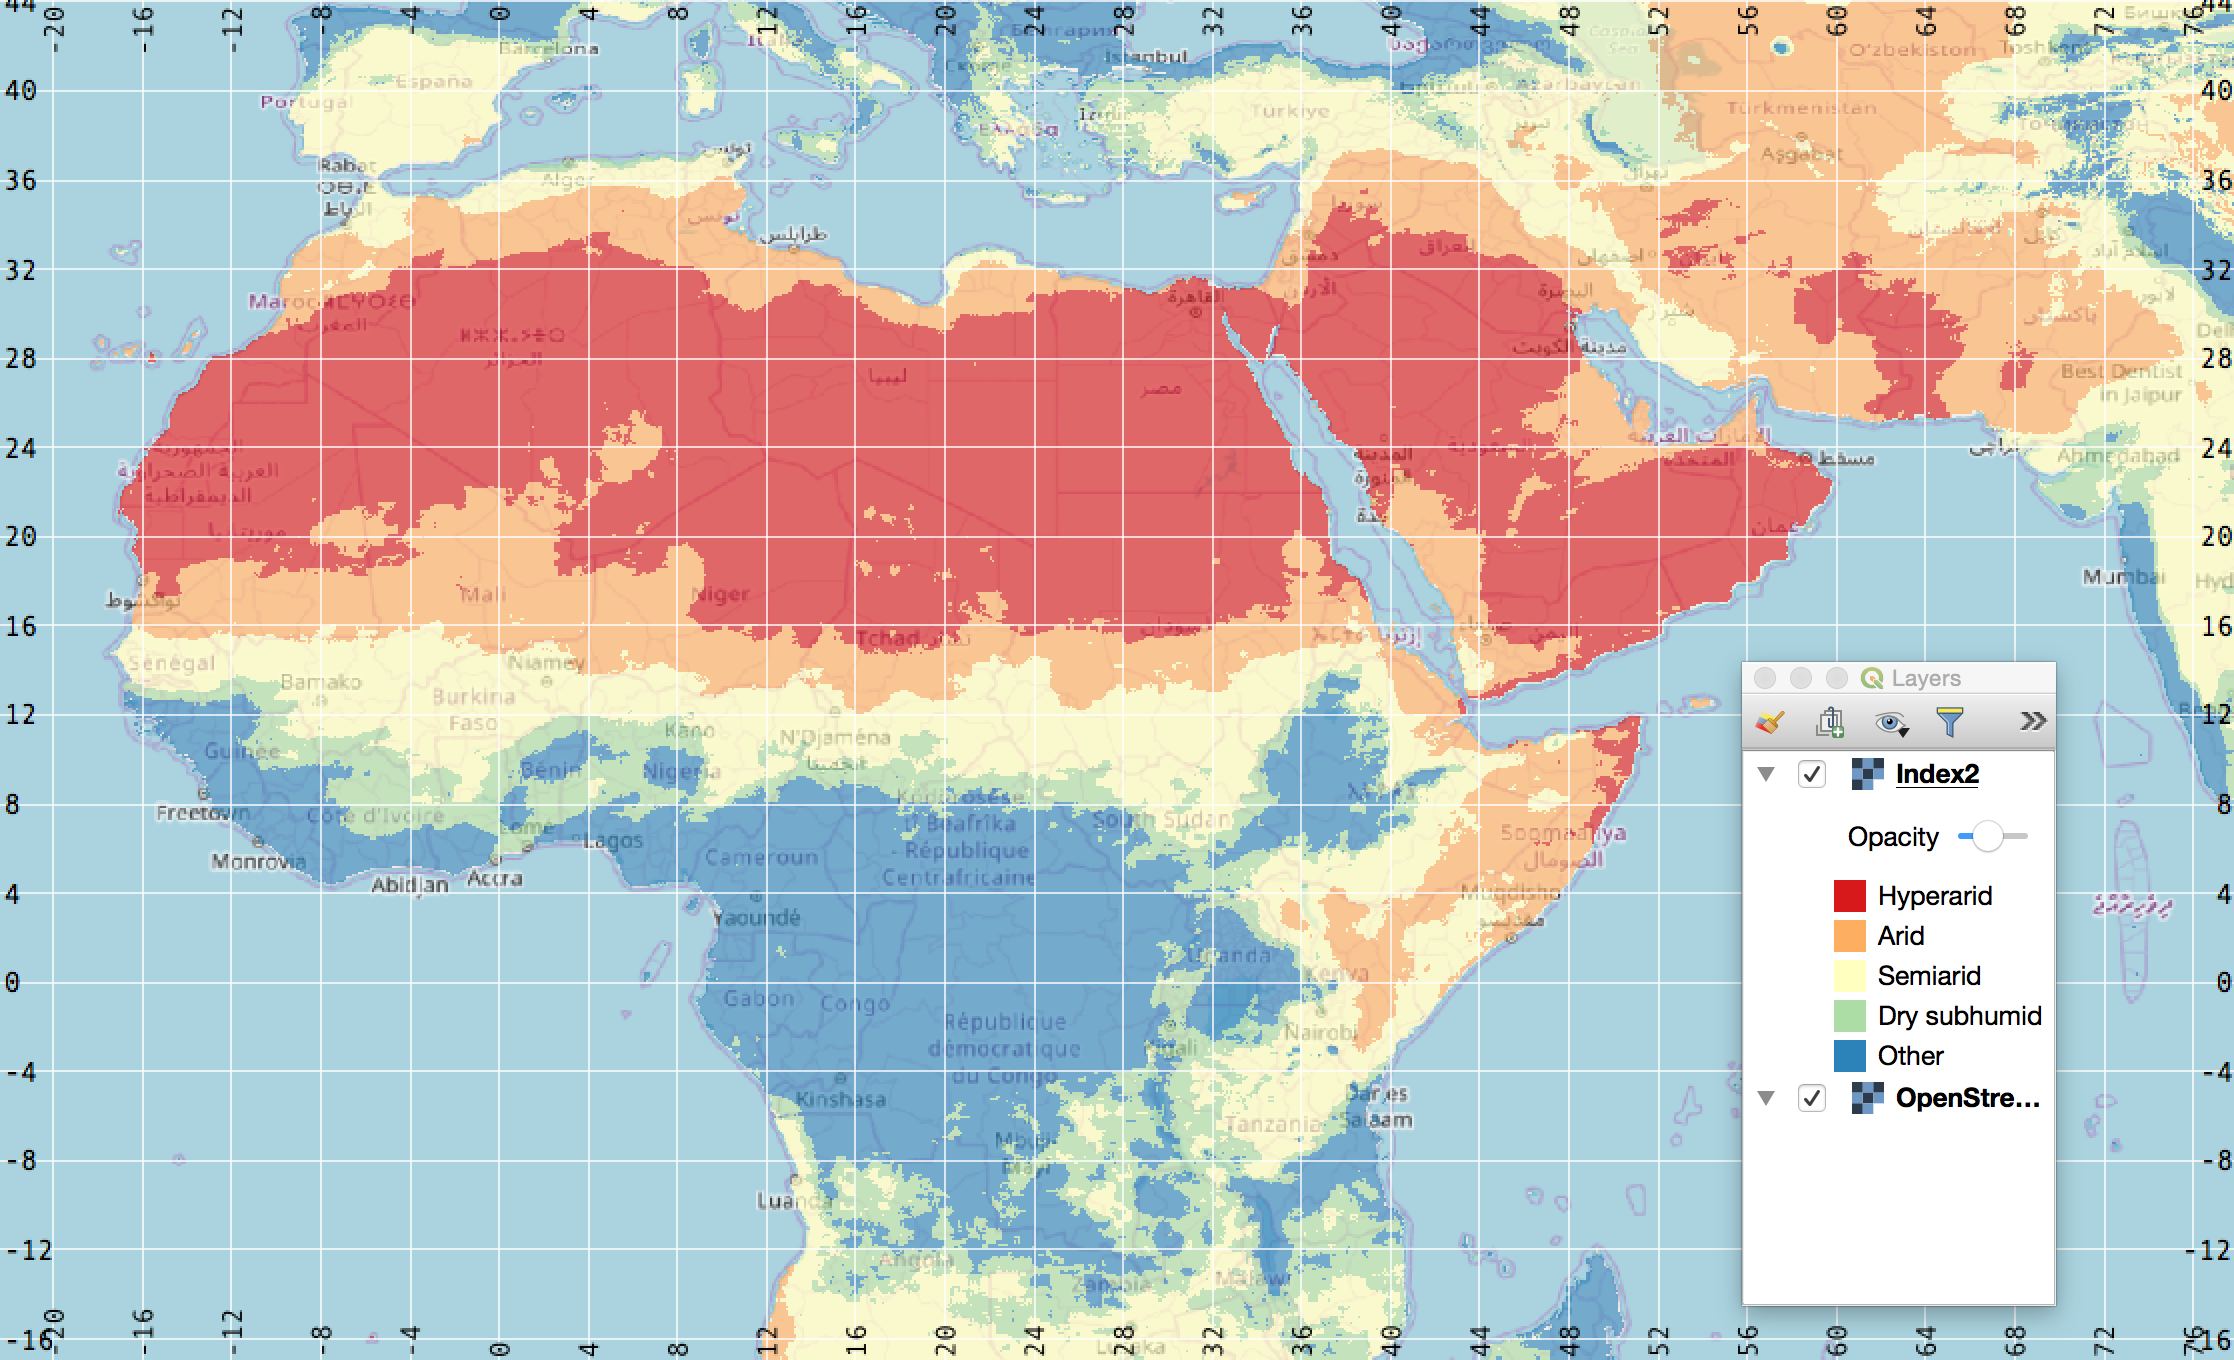
- Hyperarid: AI <0.05 (7.5 % of global land area)
- Arid: 0.05 <AI <0.20 (12.1 % land)
- Semi-Arid: 0.20 <AI <0.50 (17.7 % land)
- Dry subhumid: 0.50 <AI <0.65 (9.9 % land)
On the scientific research and publications there are several maps of arid areas, and even interesting correlation with the vegetation indexes; however this tutorial wants to enhance the capabilities of a normal GIS user into the problem definition, spatial analysis, and critical thinking with the available imagery and GIS tools.
Global Potential Evapotranspiration (PET) dataset came from the Global Aridity and PET Database (http://www.cgiar-csi.org/data/global-aridity-and-pet-database). PET raster resolution had an original resolution of 30 arc seconds (~1km at equator) that was changed to 0.1 degrees in this tutorial in order to decrease the computation time and match the resolution of the precipitation raster.
Close up of the arid zones in the Sahara Desert. Hyperarid condition can be found from the parallel 19N to 39N in Africa with a similar trend in the Arabic Peninsula, Somalia, West of Pakistan and South of Afghanistan.


