
Geopandas tools for the representation and analysis of water chemistry data - Tutorial
/
This tutorial explores a powerful interactive GeoPandas tool that facilitates the visual analysis and representation of water chemistry data. Through this Python workflow, you can display sampling points over satellite imagery and various basemaps, map concentrations using automatic color scales, and adjust marker sizes based on analyzed parameters. This direct integration allows you to customize the variables displayed on hover, streamlining data evaluation for baseline studies or water pollution diagnostics.
Tutorial
Code
#!pip install altair altair_tiles
#!pip install folium==0.12.0
#!pip install mapclassify
import geopandas as gpdptDf = gpd.read_file('Shp/Datos_Subterranea2.shp')
ptDf.keys()[15:]ptDf.explore()ptDf.explore(column='STD', tiles='https://mt1.google.com/vt/lyrs=s&x={x}&y={y}&z={z}', attr='Google')ptDf.explore(column='STD',
tiles='https://mt1.google.com/vt/lyrs=s&x={x}&y={y}&z={z}',
attr='Google',
style_kwds={
"style_function": lambda feature: {
"radius": feature["properties"]["pH"]}})ptDf.explore(column='STD',
tiles='https://mt1.google.com/vt/lyrs=s&x={x}&y={y}&z={z}',
attr='Google',
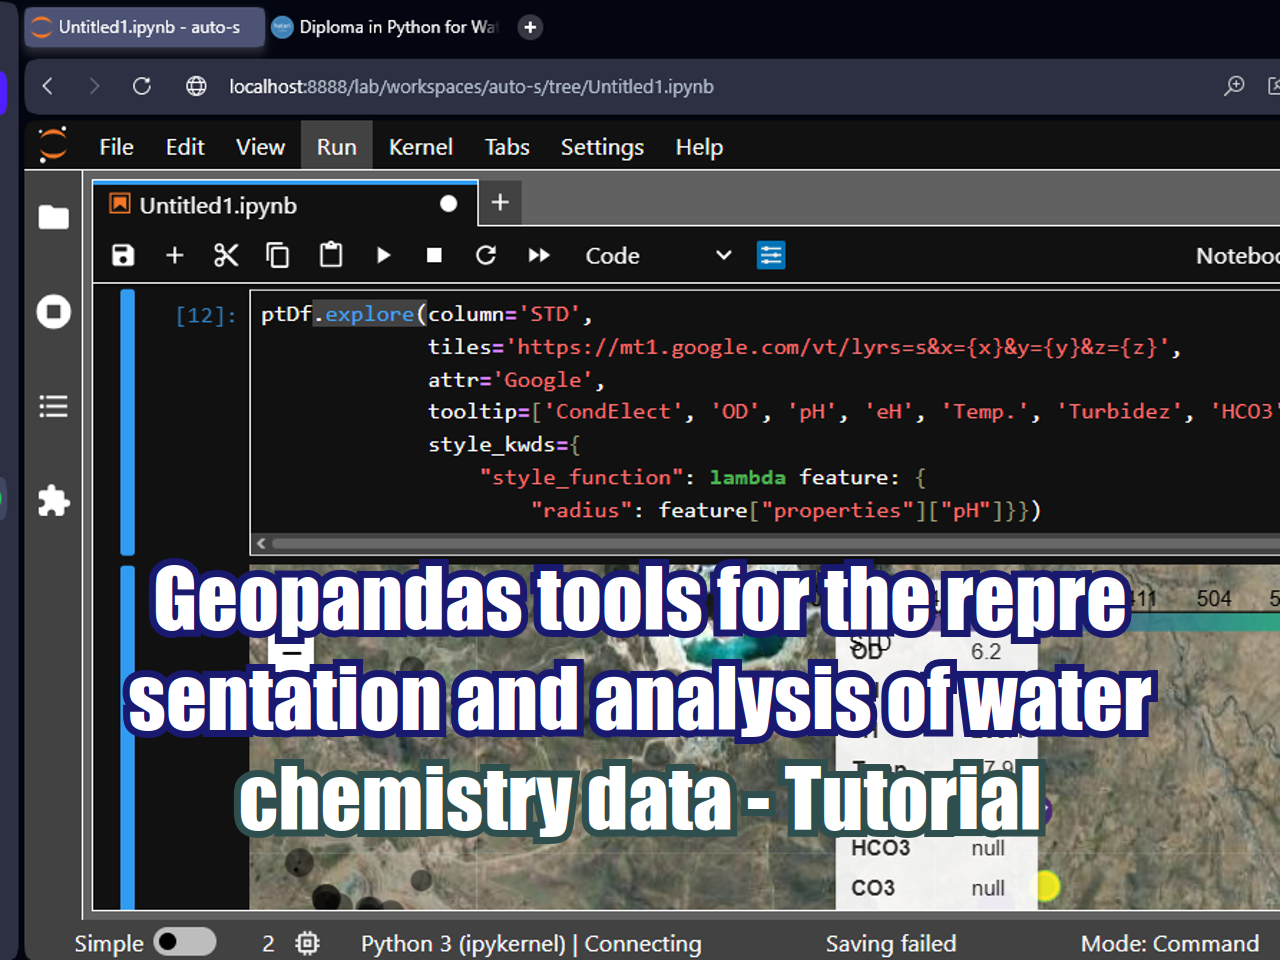
tooltip=['CondElect', 'OD', 'pH', 'eH', 'Temp.', 'Turbidez', 'HCO3', 'CO3', 'AlcalTot', 'Dureza', 'STD'],
style_kwds={
"style_function": lambda feature: {
"radius": feature["properties"]["pH"]}})