Geospatial triangular interpolation with Python, Scipy, Geopandas and Rasterio - Tutorial
/
Under the concept of “applied geospatial Python” we have developed some procedures / tutorials of some common spatial analysis tasks done on desktop GIS software. The aim isn’t to reinvent the wheel but to explore the current Python tools and libraries that can create, analyze and represent both vector and raster spatial data.
Triangular interpolation is one of several types of interpolation techniques available in both Python and GIS software, however the advantage of working with Python is that the interpolation is a function where you can get the interpolated value on a specific point while in GIS software you are required to create a raster and sample values from the raster (.. as far as we know).
We have created a tutorial with a complete procedure in Python to import points with elevation as a attribute, creates a triangular interpolation function and has two spatial outputs: an interpolated geospatial raster in TIFF format and a shapefile with elevation attribute for another set of points. The tutorial uses several Python libraries as Matplotlib, Rasterio, Geopandas, Scipy.
Tutorial
There is a previous tutorial to install Rasterio available in this link.
Input data
Download the input data for the tutorial from this link.
Code
This is the complete Python script:
Import required libraries
import numpy as np
import geopandas as gpd
import matplotlib.pyplot as plt
from matplotlib.tri import Triangulation, LinearTriInterpolator
import rasterio
Open shapefiles with elevation as attribute
points3d = gpd.read_file('../shps/points3d.shp')
print(points3d.head())
print(points3d.crs)
fid elev geometry
0 12.0 4121.0 POINT (623726.099 8359792.877)
1 13.0 4346.0 POINT (623622.358 8360574.771)
2 155.0 4159.0 POINT (623957.164 8359886.584)
3 156.0 4204.0 POINT (623717.372 8360034.787)
4 157.0 4298.0 POINT (623863.906 8360529.003)
epsg:32718Get numpy array with XYZ point data
totalPointsArray = np.zeros([points3d.shape[0],3])
#iteration over the geopandas dataframe
for index, point in points3d.iterrows():
    pointArray = np.array([point.geometry.coords.xy[0][0],point.geometry.coords.xy[1][0],point['elev']])
    totalPointsArray[index] = pointArray
totalPointsArray[:5,:]
array([[6.23726099e+05, 8.35979288e+06, 4.12100000e+03],
[6.23622358e+05, 8.36057477e+06, 4.34600000e+03],
[6.23957164e+05, 8.35988658e+06, 4.15900000e+03],
[6.23717372e+05, 8.36003479e+06, 4.20400000e+03],
[6.23863906e+05, 8.36052900e+06, 4.29800000e+03]])Required elements for the triangular interpolation
#triangulation function
triFn = Triangulation(totalPointsArray[:,0],totalPointsArray[:,1])
#linear triangule interpolator funtion
linTriFn = LinearTriInterpolator(triFn,totalPointsArray[:,2])
Interpolated raster generation
#define raster resolution in (m)
rasterRes = 2

xCoords = np.arange(totalPointsArray[:,0].min(), totalPointsArray[:,0].max()+rasterRes, rasterRes)
yCoords = np.arange(totalPointsArray[:,1].min(), totalPointsArray[:,1].max()+rasterRes, rasterRes)
zCoords = np.zeros([yCoords.shape[0],xCoords.shape[0]])

#loop among each cell in the raster extension
for indexX, x in np.ndenumerate(xCoords):
    for indexY, y in np.ndenumerate(yCoords):
        tempZ = linTriFn(x,y)
        #filtering masked values
        if tempZ == tempZ:
            zCoords[indexY,indexX]=tempZ
        else:
            zCoords[indexY,indexX]=np.nan

#preliminary representation of the interpolated values
plt.imshow(zCoords)
<matplotlib.image.AxesImage at 0x2bc3de53cd0>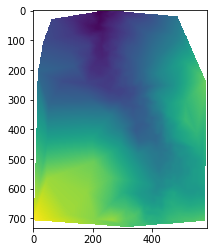
#definition of the raster transform array
from rasterio.transform import Affine
transform = Affine.translation(xCoords[0] - rasterRes/2, yCoords[0] - rasterRes/2) * Affine.scale(rasterRes, rasterRes)
transform
Affine(2.0, 0.0, 623621.3579761666,
0.0, 2.0, 8359156.448053772)#get crs as wkt
from rasterio.crs import CRS
rasterCrs = CRS.from_epsg(32718)
rasterCrs.data{'init': 'epsg:32718'}#definition, register and close of interpolated raster
triInterpRaster = rasterio.open('../rst/triangleInterpolation.tif',
'w',
driver='GTiff',
height=zCoords.shape[0],
width=zCoords.shape[1],
count=1,
dtype=zCoords.dtype,
#crs='+proj=latlong',
crs={'init': 'epsg:32718'},
transform=transform,
)
triInterpRaster.write(zCoords,1)
triInterpRaster.close()Get interpolated values as shapefile
#open shapefile with points to interpolate
pointsToInterpolate = gpd.read_file('../shps/pointsToInterpolate.shp')
print(pointsToInterpolate.head())
FID geometry
0 115 POINT (623897.706 8359742.063)
1 115 POINT (623707.724 8359669.288)
2 115 POINT (623841.389 8359910.562)
3 115 POINT (623902.708 8359776.667)
4 115 POINT (623897.706 8359742.063)#interpolation over points
interpolatedPoints = pointsToInterpolate
interpolatedPoints['elev'] = ''
for index, point in interpolatedPoints.iterrows():
tempZ = linTriFn(point.geometry.coords.xy[0][0],point.geometry.coords.xy[1][0])
if tempZ == tempZ:
interpolatedPoints.loc[index,'elev'] = float(tempZ)
else:
interpolatedPoints.loc[index,'elev'] = np.nan#save as shapefile
interpolatedPoints.to_file('../shps/interpolatedPoints.shp')Spatial representation of input and output data
from rasterio.plot import show
src = rasterio.open("../rst/triangleInterpolation.tif")

fig, ax = plt.subplots(figsize=(24,16))
ax.set_xlim(624000,624600)
ax.set_ylim(8359400,8359800)
points3d.plot(ax=ax, marker='D',markersize=50, color='gold')
interpolatedPoints.plot(ax=ax, markersize=10, color='orangered')
show(src)
plt.show()