

How to export MODFLOW head contours as Shapefiles with Flopy - Tutorial
/
The quality of a groundwater model as a tool for sustainable management of our groundwater resources doesn´t on the quality of the input data, the accuracy of the calibration but also on the visualization of the output data and analysis of the water budget. There are several options to export contours from MODFLOW GUIs as Model Muse, however when analyzing several stress periods the graphical steps could be time consuming therefore a Python script would be helpful to export heads or water table as shapefiles.
You will need a conda environment with geospatial tools for the tutorial. Create the environment following this link: hatarilabs.com/ih-en/how-to-install-python-geopandas-in-windows-on-a-conda-environment-tutorial
Video
Code
#!pip install flopy
import os
import numpy as np
import matplotlib.pyplot as plt
import flopy
#import shapefile as sf #in case you dont have it, form anaconda prompt: pip install pyshp
from flopy.utils.gridgen import Gridgen
from flopy.utils.reference import SpatialReference
import pandas as pd
from scipy.interpolate import griddata
modelname='regionalModel1'
model_ws= '../Model/'
mf = flopy.modflow.Modflow.load(modelname+'.nam', version="mfnwt" ,model_ws=model_ws)# Lower left corner: (611991.514073899, 8354016.396838)
# Grid angle (in degrees counterclockwise): -24
xll = 611991.514073899
yll = 8354016.396838
epsg = 32718
rotation = -24
mf.modelgrid.set_coord_info(xoff=xll, yoff=yll, angrot=rotation,epsg=2236)fig = plt.figure(figsize=(8,8))
ax = fig.add_subplot(1, 1, 1, aspect='equal')
modelmap = flopy.plot.PlotMapView(model=mf)
linecollection = modelmap.plot_grid(linewidth=0.5, color='royalblue')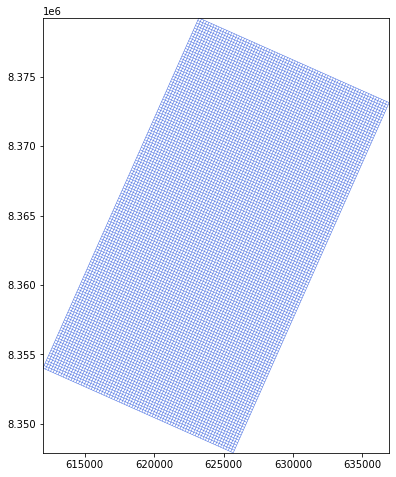
#import head data
mfheads = flopy.utils.HeadFile('../Model/'+modelname+'.bhd',text='head')
mftimes = mfheads.get_times()
mftimes[:3][1.0]# find shape
head = mfheads.get_data()
shape = head.shape
shape(5, 138, 75)#create a array an empty array
drnArray = np.zeros(shape[1:])
drnArray[:] = np.NaN
#fill the values for the water table
for row in range(shape[1]):
for col in range(shape[2]):
drnValues = head[:,row,col]
for value in drnValues:
if value > 0:
drnArray[row,col]=value
break
plt.imshow(drnArray)<matplotlib.image.AxesImage at 0x1b54ae10970>
#get min and max head for contour levels
headMin = head[head>-1.e+20].min()
headMax = head[head>-1.e+20].max()
print(headMin,headMax)
3431.9033 4439.018#define contours levels
levels = np.linspace(headMin,headMax,25)
levelsarray([3431.90332031, 3473.86643473, 3515.82954915, 3557.79266357,
3599.75577799, 3641.71889242, 3683.68200684, 3725.64512126,
3767.60823568, 3809.5713501 , 3851.53446452, 3893.49757894,
3935.46069336, 3977.42380778, 4019.3869222 , 4061.35003662,
4103.31315104, 4145.27626546, 4187.23937988, 4229.2024943 ,
4271.16560872, 4313.12872314, 4355.09183757, 4397.05495199,
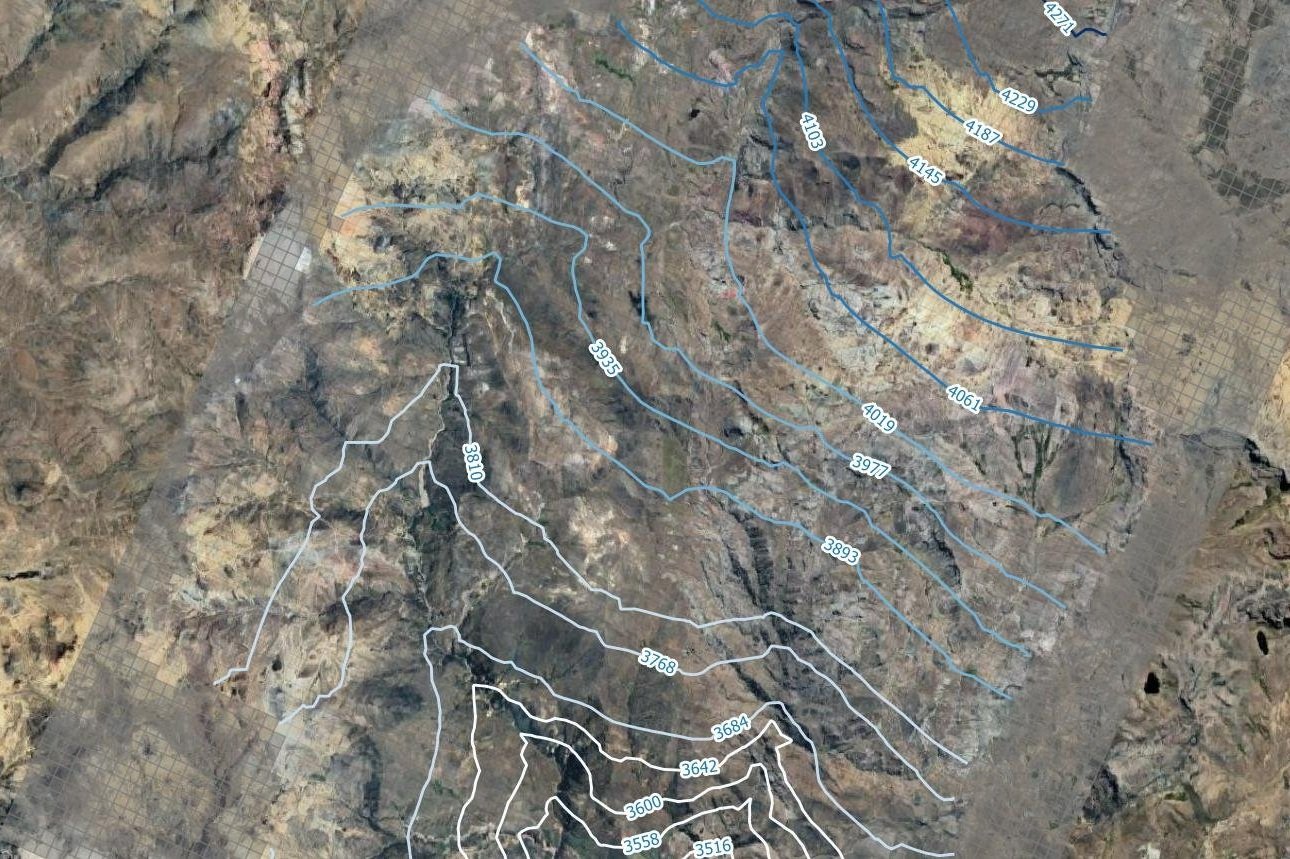
4439.01806641])# Plot the heads for a defined layer and boundary conditions
fig = plt.figure(figsize=(36, 24))
ax = fig.add_subplot(1, 1, 1, aspect='equal')
modelmap = flopy.plot.PlotMapView(model=mf)
contour = modelmap.contour_array(drnArray,ax=ax, levels=levels)
cellhead = modelmap.plot_array(drnArray,ax=ax, cmap='Blues', alpha=0.2)
ax.clabel(contour)
ax.grid()
plt.tight_layout()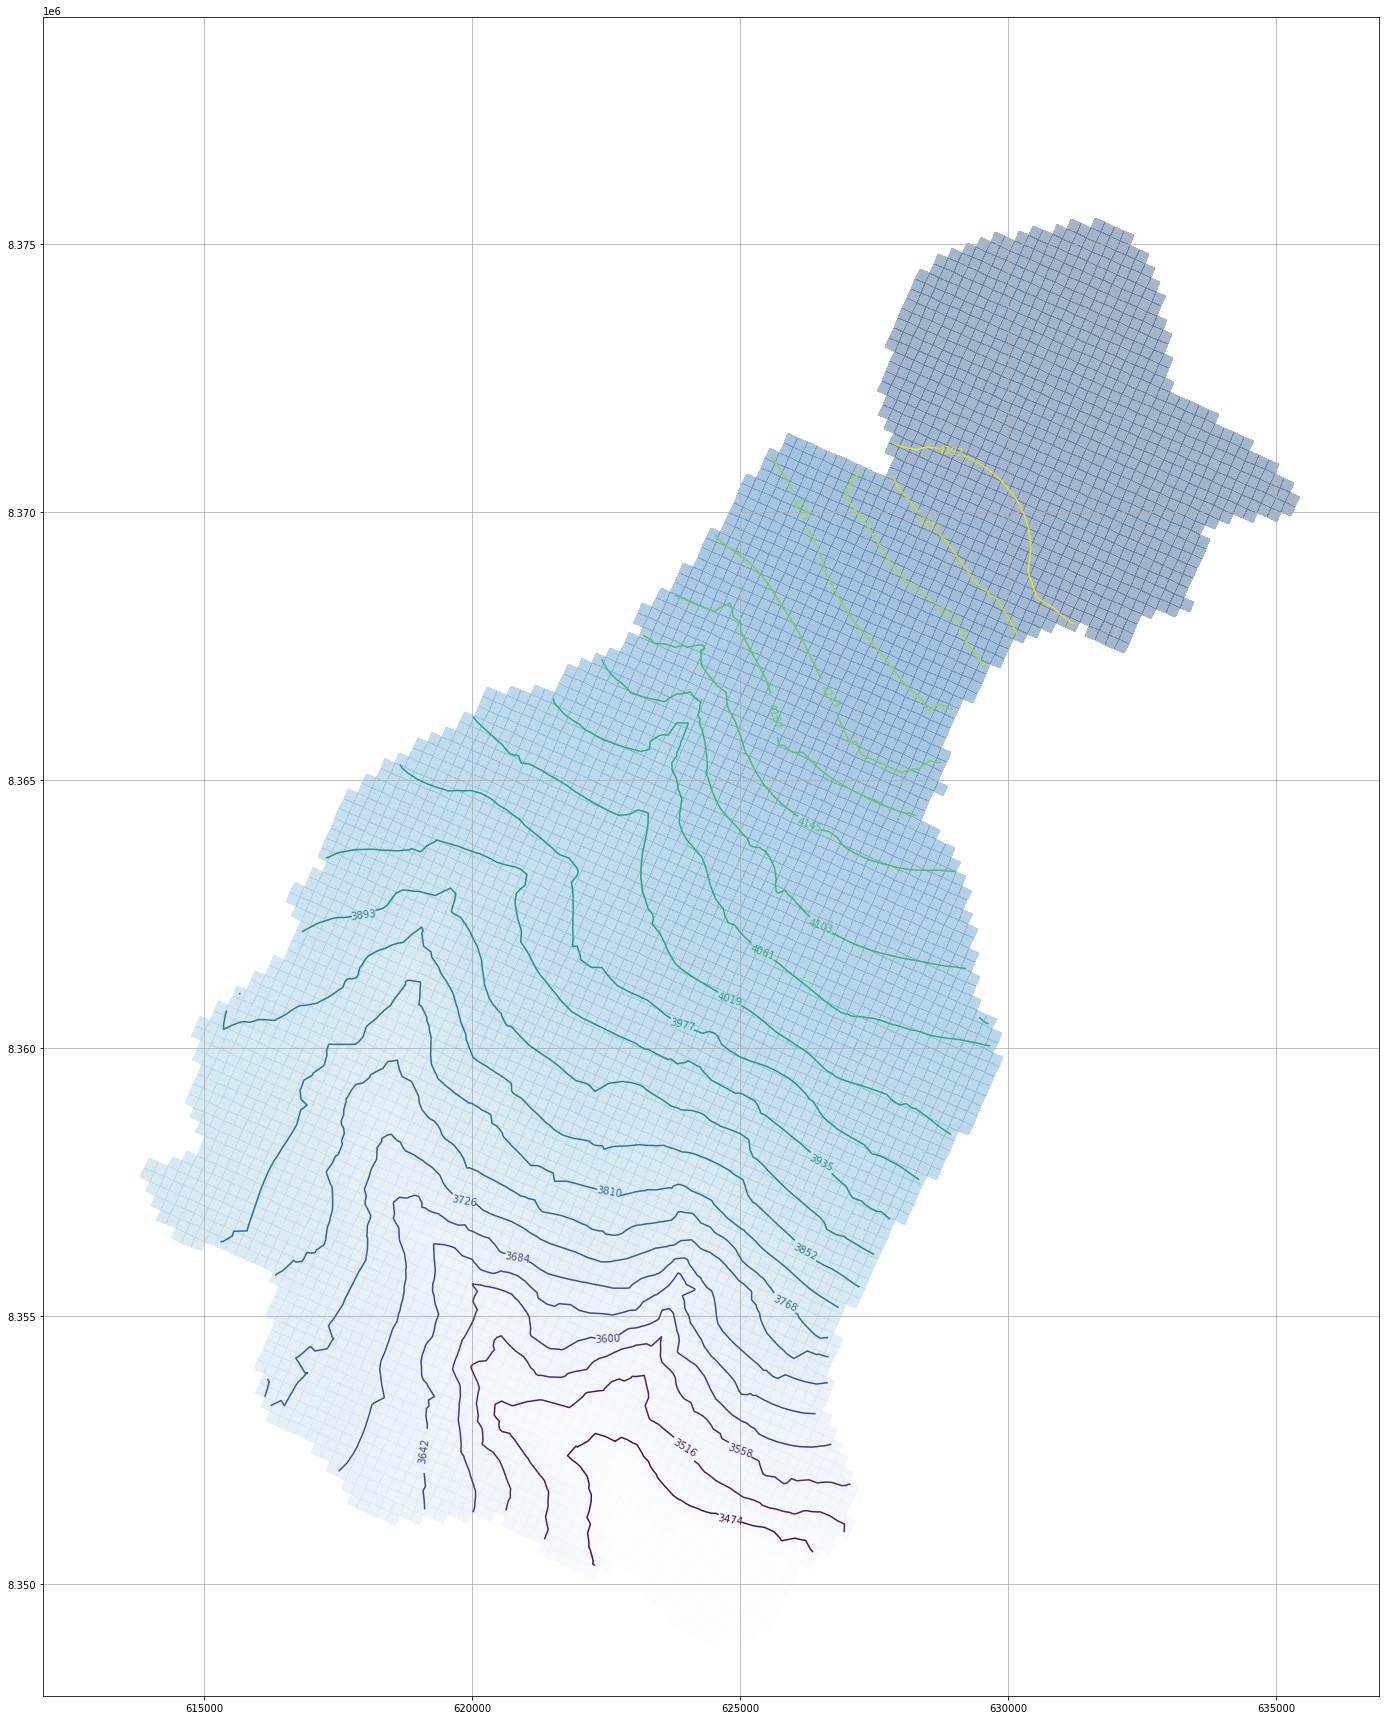
import fiona

# define schema
schema = {
    'geometry':'LineString',
    'properties':[('waterTable','float')]
}
#open a fiona object
polyShp = fiona.open('../Shps/waterTable_v1.shp', mode='w', driver='ESRI Shapefile',
          schema = schema, crs = "EPSG:32718")

for index, c in enumerate(contour.allsegs):
    try:
    #save record and close shapefile
        tupleList = [(a[0],a[1]) for a in c[0]]
        #print(tupleList)
        rowDict = {
            'geometry' : {'type':'LineString',
                             'coordinates': tupleList}, #Here the xyList is in brackets
            'properties': {'waterTable' : contour.cvalues[index]},
            }
        polyShp.write(rowDict)
    except IndexError:
        pass

#close fiona object
polyShp.close()
Input data
You can download the input data from this link.


