

How to generate a legend on map canvas in QGIS with PyQGIS - Tutorial
/
QGIS is a powerful and user friendly GIS software. The user can represent points and style them according to the measured values. This tutorial deals with the legend representation on map canvas for a better geospatial data analysis.
Legend representation is done with just 6 lines of code on PyQGIS, the Python tool of QGIS.
PyQGIS
from qgis.gui import *
root = QgsProject.instance().layerTreeRoot()
model = QgsLayerTreeModel(root)
view = QgsLayerTreeView()
view.setModel(model)
view.show()
Tutorial
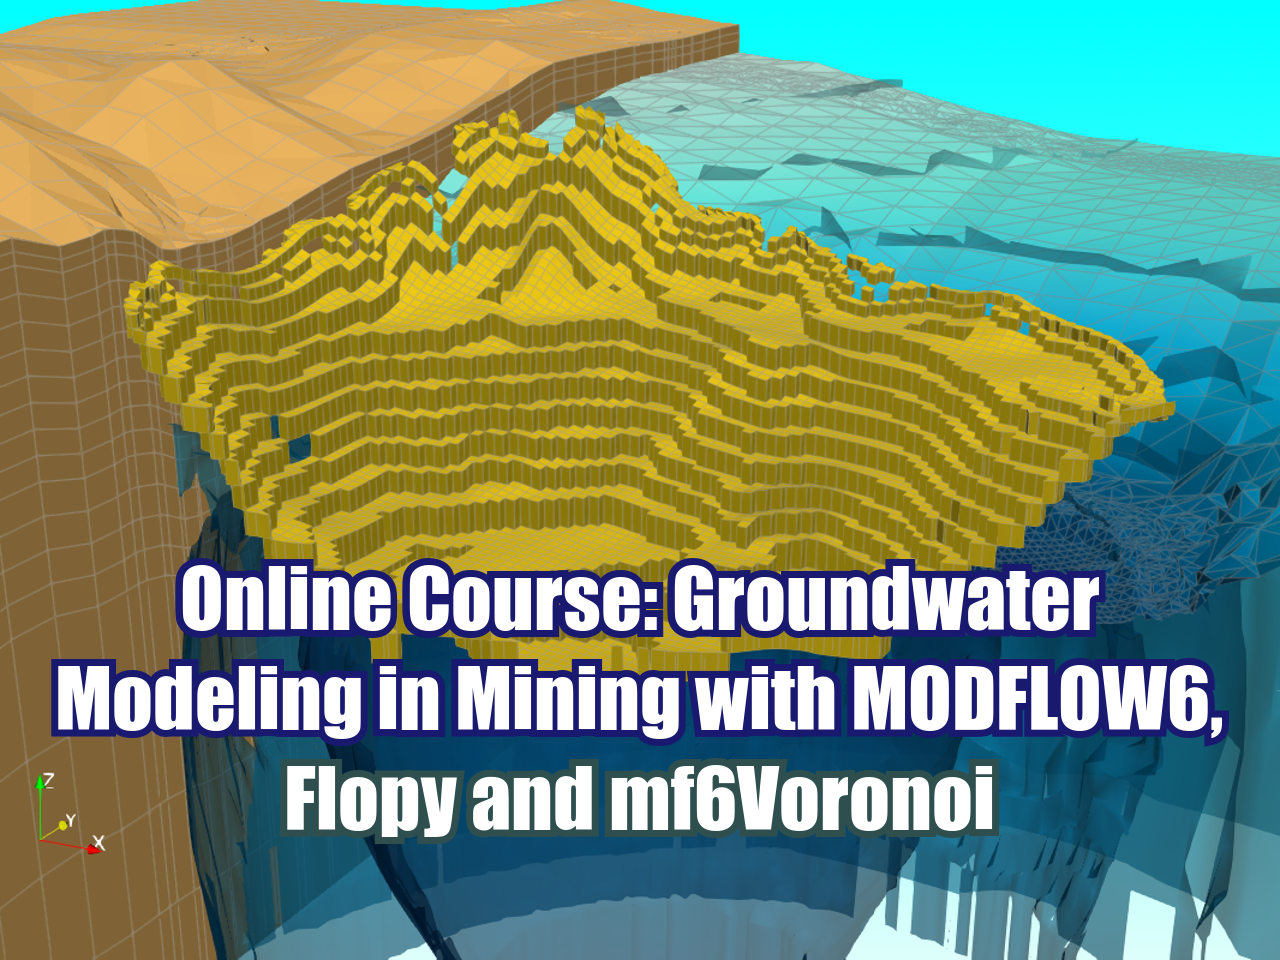
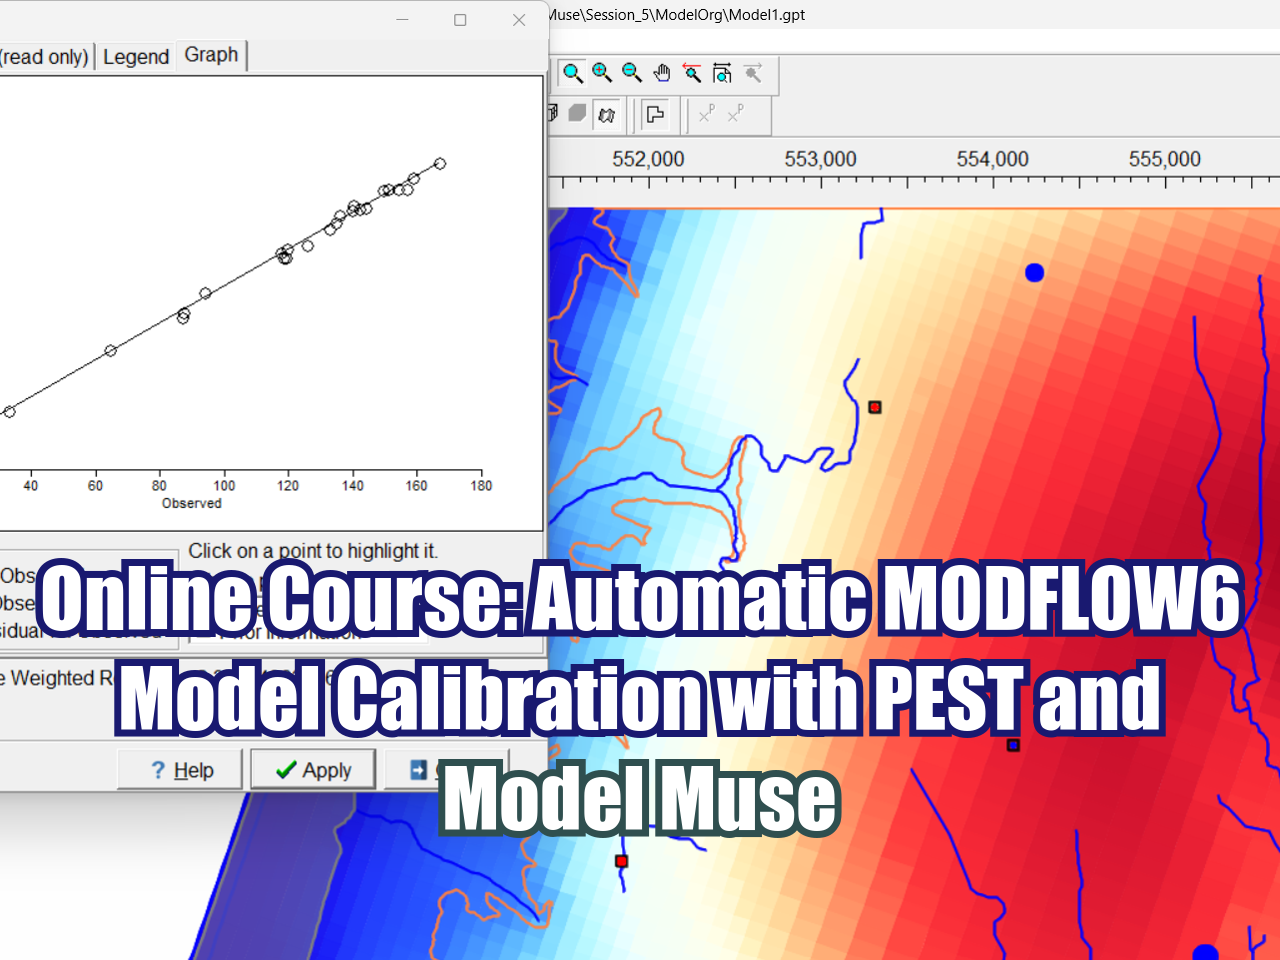











FloPy is the Python library that builds and executes MODFLOW models; this library has been enhanced to provide full support of MODFLOW 6 with most of its recent development is related to functionality for MODFLOW 6, tools to use vector and raster spatial data and common plotting and export functionality.