

How to join lines and densify vertices with Python, Fiona, Shapely - Tutorial
/
We have done a tutorial under the concept of "applied geospatial Python". This is an example that deals with a selective filtering of a determined road from a road geopackage. The selected road is composed of a group of lines that are merged into a Shapely LineString. Based on a Numpy linspace with the Shapely interpolate function, a set of points were distributed along the merged line path and later interpreted as a LineString. Resulting line was saved as a ESRI Shapefile file with Fiona.
Tutorial
Code
This is the complete Python code:
# import required packages
import fiona
import numpy as np
from shapely.geometry import LineString, MultiLineString
from shapely import ops
import mplleaflet as mpl
import matplotlib.pyplot as plt
Open the vector file and filter road
Read the Geopackage with Fiona and filter designated road parts
tolucaRoads = fiona.open('../vector/roadsToluca.gpkg')
tolucaRoads.mode'r'multiLineList = []
for road in tolucaRoads:
if road['properties']['name'] == 'Avenida José María Morelos y Pavón':
multiLineList.append(road['geometry']['coordinates'])
multiLineString = MultiLineString(multiLineList)
len(multiLineString)34Merge all road segments
mergedRoad = ops.linemerge(multiLineString)
mergedRoadmergedRoad.length0.03321053670630725Densify points along the line
# create a linespace of points
lenSpace = np.linspace(0,mergedRoad.length,1000)

tempList = []
for space in lenSpace:
    tempPoint = mergedRoad.interpolate(space)
    tempList.append(tempPoint)

denseRoad = LineString(tempList)
denseRoad
Plot merged road and densified road
# Check the diference over a plot
fig, (ax1, ax2) = plt.subplots(2,1,figsize=(18,8), sharex=True)

ax1.plot(mergedRoad.xy[0], mergedRoad.xy[1], ls='--', marker='*')
#ax1.set_aspect('equal')
ax1.set_xlim(np.quantile(mergedRoad.xy[0],0.2),np.quantile(mergedRoad.xy[0],0.25))
ax2.plot(denseRoad.xy[0], denseRoad.xy[1], ls='--', marker='o')
#ax2.set_aspect('equal')
plt.plot()
[]
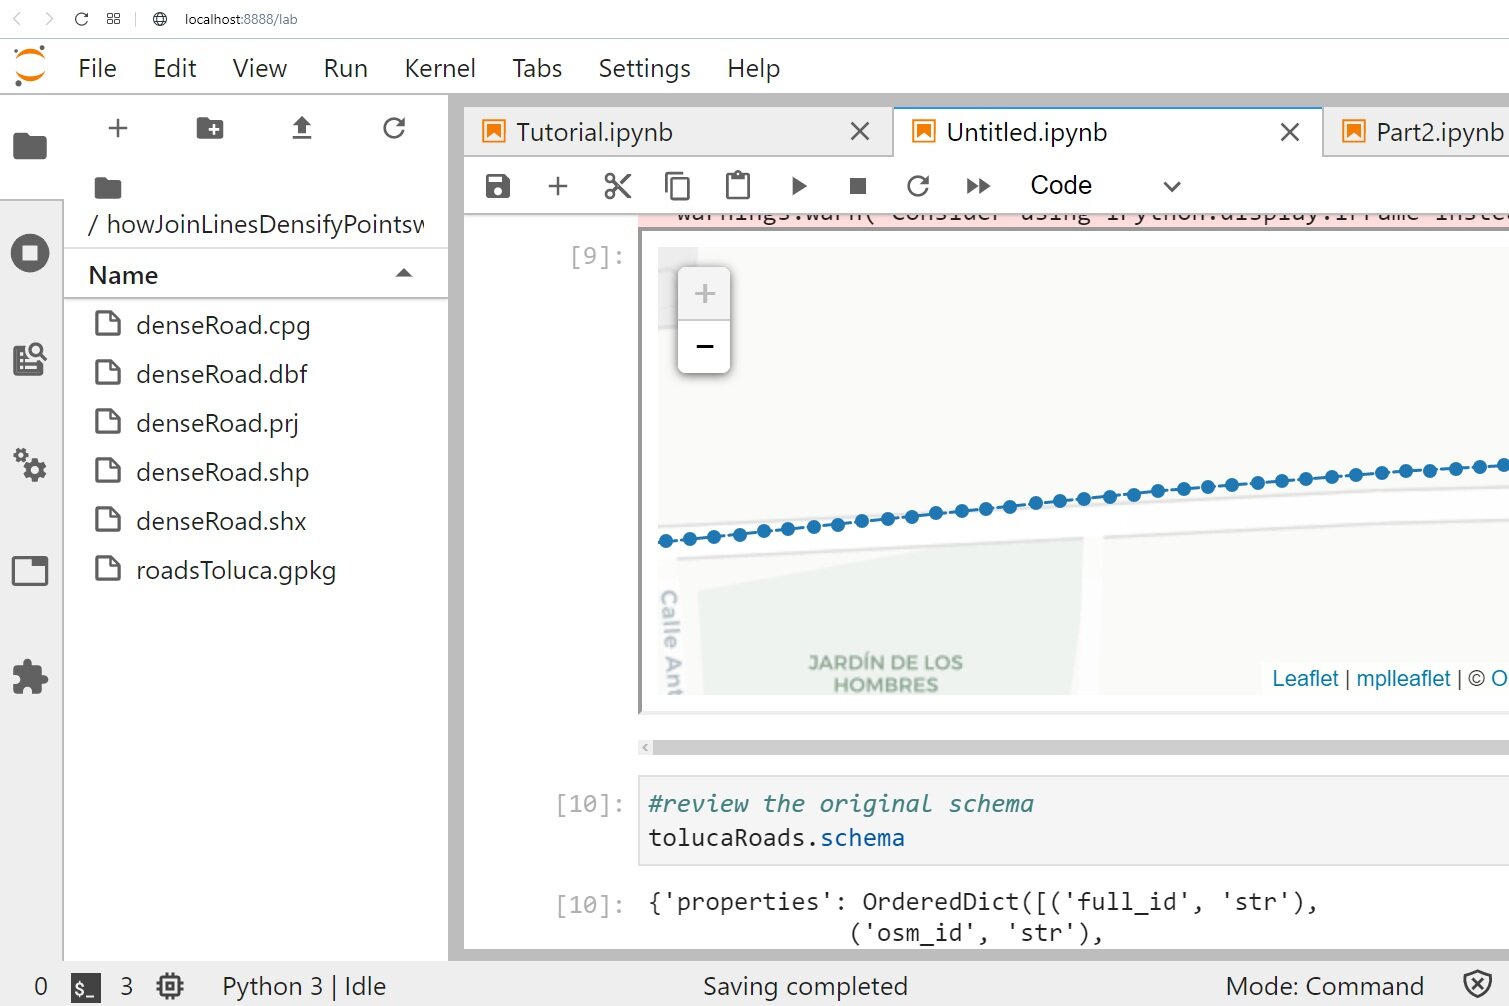
# Check the resulting linestring
fig, ax1 = plt.subplots()


ax1.plot(denseRoad.xy[0], denseRoad.xy[1], ls='--', marker='o')
ax1.set_aspect('equal')

mpl.display(tiles='cartodb_positron')

C:\Users\GIDA2\miniconda3\lib\site-packages\IPython\core\display.py:717: UserWarning: Consider using IPython.display.IFrame instead
  warnings.warn("Consider using IPython.display.IFrame instead")
Save resulting densified road to shapefile
#review the original schema
tolucaRoads.schema

{'properties': OrderedDict([('full_id', 'str'),
              ('osm_id', 'str'),
              ('osm_type', 'str'),
              ('highway', 'str'),
              ('lanes', 'str'),
              ('oneway', 'str'),
              ('surface', 'str'),
              ('name', 'str'),
              ('turn:lanes', 'str'),
              ('bus:lanes', 'str'),
              ('ref', 'str'),
              ('alt_name', 'str'),
              ('short_name', 'str'),
              ('bridge', 'str')]),
 'geometry': 'LineString'}

# save the resulting line to shapefile

schema = {
    'properties':{},
    'geometry':'LineString'
}
#out shape
outShp = fiona.open('../vector/denseRoad.shp',mode='w',driver='ESRI Shapefile',schema=schema,crs=tolucaRoads.crs)
coordList = list(denseRoad.coords)

feature = {
    'geometry':{'type':'LineString','coordinates':coordList},
    'properties':{}
     }
outShp.write(feature)

outShp.close()
Input data
You can download the input files for this tutorial here.


