Massive Operations on Rasters with QGIS3 and Python - Tutorial
/There are new available tools and resources to understand climate change, land use dynamics, water cycle and other parts of our physical environment. Many spatial data come on raster format and are available on web servers, those servers have a image register every year, every month, every day, hour, half hour or minute. If we want to assess a physical phenomena we have to be able to analyze large set of data.
Traditional GIS approach and tools were focussed in performing a spatial algorithm on a single layer or a small group of layers, however, we need to develop and use tools to increase our data manipulation capabilities to undefined number of layers; afortunately this can be done on the same QGIS software with Python console.
If we deal with raster data, it is important to remember that all rasters are in fact matrices with a spatial georeference. When the amount of required operation to rasters is huge, it is preferable to convert the rasters to matrixes (or 2D Numpy arrays), to perform operations with Numpy tools and then to geotransform them to matrixes. Concerning the spatial suitability of our matrix algebra, all raster files need to have the same raster resolution, projection and dimesion.
Python code
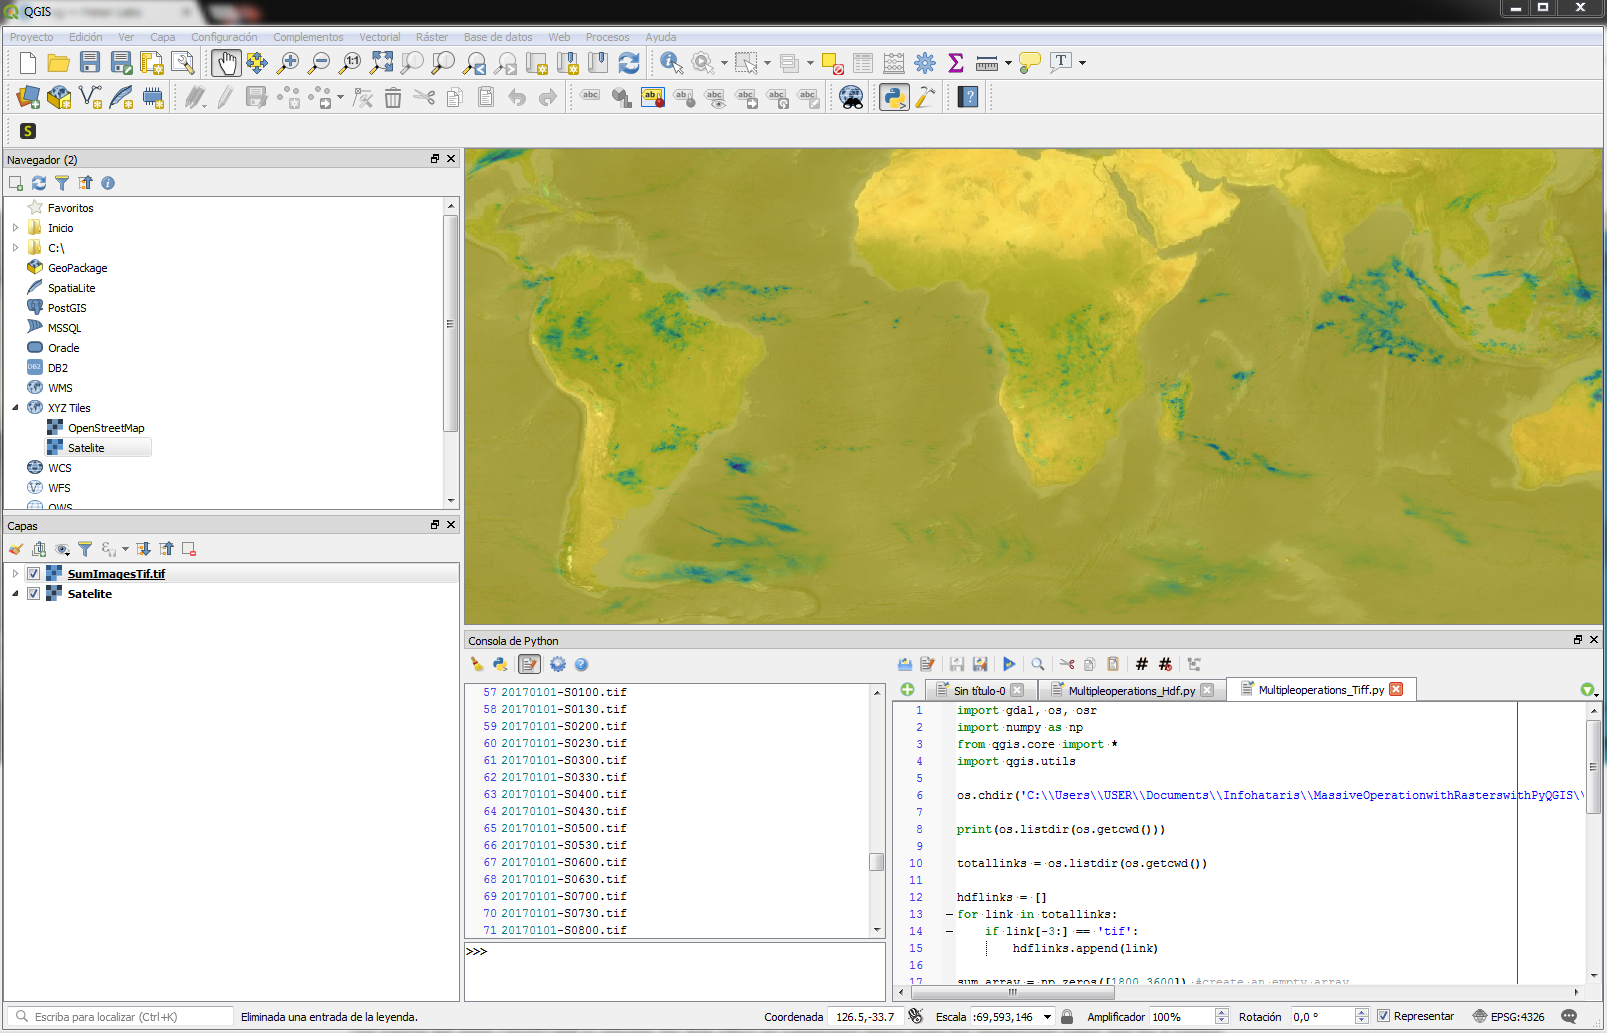
Python code capable to do multiple operation on rasters is not pretended to be long with scripts in the order of 40 to 60 lines upon the level of the required analysis. Most of the Python efficiency for raster analysis come from the loops, conditionals, matrix operations in Numpy and tools to open and write files. There are two versions of the Python code, one for HDF5 files and the other for Tiff files, that works almost on the same direction. Here is the HDF5 version:
import gdal, os, osr
import numpy as np
from qgis.core import *
import qgis.utils

os.chdir('C:\\Users\\USER\\Documents\\Infohataris\\MassiveOperationwithRasterswithPyQGIS\\HDF5')
print(os.listdir(os.getcwd()))
totallinks = os.listdir(os.getcwd())

hdflinks = []
for link in totallinks:
    if link[-4:] == 'HDF5':
        hdflinks.append(link)

sum_array = np.zeros([1800,3600])

for link in hdflinks:
    hdf_ds = gdal.Open(link, gdal.GA_ReadOnly)
    print(link)
    band_ds = gdal.Open(hdf_ds.GetSubDatasets()[5][0], gdal.GA_ReadOnly) #choose the 5th dataset that corresponds to precipitationCal
    band_array = band_ds.ReadAsArray()
    band_array[band_array<0] = 0 #filter all NaN values that appear as negative values, specially for the tiff representation
    sum_array = band_array.T[::-1]*0.5 + sum_array

geotransform = ([-180,0.1,0,90,0,-0.1])
raster = gdal.GetDriverByName('GTiff').Create("../Sum/SumImagesHdf.tif",3600,1800,1,gdal.GDT_Float32)
raster.SetGeoTransform(geotransform)
srs=osr.SpatialReference()
srs.ImportFromEPSG(4326)
raster.SetProjection(srs.ExportToWkt())
raster.GetRasterBand(1).WriteArray(sum_array)
raster = None

iface.addRasterLayer("../Sum/SumImagesHdf.tif","SumImagesHdf.tif","gdal")
Tutorial
This tutorial deal with the sum of 48 raster files with some matrix operations as transpose and row inverse order. Dataset come from the IMERG precipitation images every half hour for a one day (January 1 2017).


