What data do you need for hydrogeological modeling?
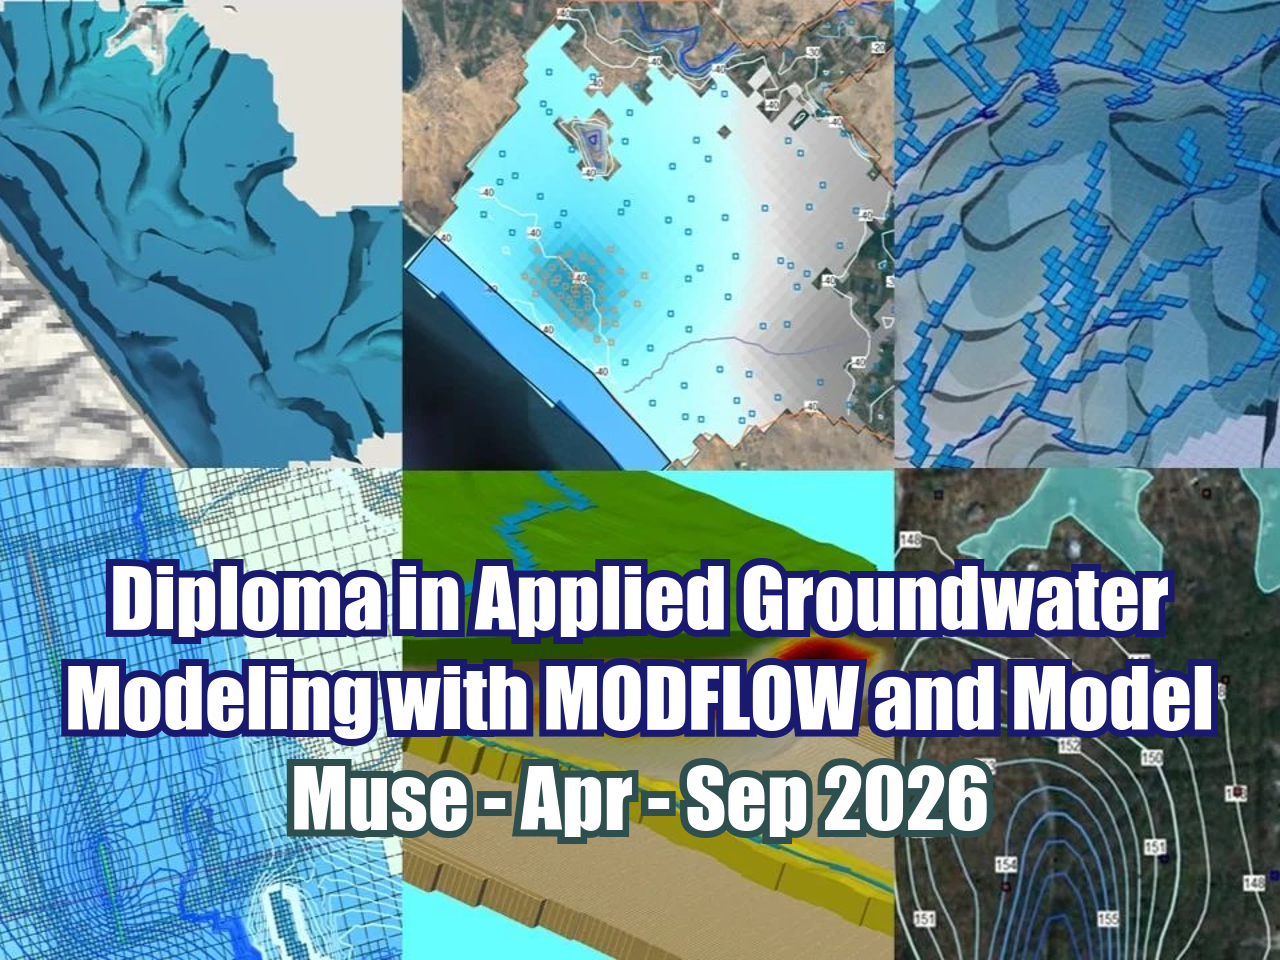
/Representation on an andean basin in a numerical model
A hydrogeological evaluation needs a numerical representation of the groundwater flow regime. Numerical models are a great tool to evaluate the current and future conditions of groundwater flow. In order to make a model, it is necessary to have geological and climate data, among other types.
The following list describes the input data needed to carry out a hydrogeological modeling. The information required could be either in tabular or vectorial format.
Spatial Data
All these data have to be in ESRI Shapefile format (*.shp). All the spatial information has to be referenced to the projection system of the project. Use projected coordinates (UTM).
Topography
Digital Elevation Model - Regional
Topography every 50 m to 25 m encompassing the involved basins.
Digital Elevation Model - Local
Topography every 10 m to 5 m encompassing the influence zone of the project. Consider the original elevations before the start of the project.
Digital Elevation Model - Project
Topography every 10 m to 5 m of the project installations.
Elevations - Project life
Transient modeling - Elevations year by year representing the evolution of the project installations.
Geology
Regional geology
Regional geology provided by a national geological institution, Iincluding the legends of all the geological formations.
Local geology
Local geology in the influence zone of the project. Compatibilize this geology with the regional one.
Depth of aluvial and coluvial sediments.
Interpolation of the aluvial and coluvial depths based on the geophysical studies. Interpretation of the non evaluated zones.
Hydrology
Drainage basins
Delimitation of the principal basins located in the influence area of the project.
Water streams
Delimitation of the permanent and temporary water streams.
Water bodies
Delimitation of lakes and other water bodies of the basins. Include the water surface elevation data.
Springs
Location of permanent fluxes on dry season
Wetlands
Delimitation of permanent vegetation zones on dry season.
Weather stations
Location, elevation, name and sensors of the weather stations.
Hydrogeology
Piezometric network
Location and name of the observation wells.
Production wells
Location and name of the production wells.
Tabular information
Piezometric network
Information about the location of piezometers, depth and lithology.
Production wells
Location, installation details, pumping rate and schedule.
Registry of piezometric levels
Values of piezometric levels and its corresponding time information.
Dry season flows
Monthly registry of dry season flows.
Precipitation and evapotranspiration data
Monthly averague values of precipitation and evapotranspiration of each station. Indicate the data range considered.
Pumping test results
Evaluation of static (K, T) and dynamic (Sy, Ss) hydraulic parameters.
Packer test results
Depth, interval, geology and hydraulic conductivity value in m/s.
Registry of flux entering the project
Amount of groundwater flow entering the project installations in l/s.
Observed concentration data in piezometers, water bodies and streams
Historic registry of concentrations. Include coordinates.
Revision of the previous information
Present a resume table containing the revision of the crude information. It must include the calculated and assumed parameters.


