What is a Piper diagram for water chemistry analysis and how to create one?
/Piper plot generation has never been so easy:
How to create a Piper plot online with Aquifer App - Tutorial
Link:
hatarilabs.com/ih-en/how-to-create-a-piper-plot-online-with-aquifer-app-tutorial
In 1994, Arthur M. Piper, proposed an effective graphic procedure to segregate relevant analytical data to understand the sources of the dissolved constituents in water. This procedure was born under the statement that most natural waters contain cations and anions in chemical equilibrium. It is assumed that the most abundant cations are two “alkaline earths” calcium (Ca) and magnesium (Mg) and one “Alkali” sodium (Na). The most common anions are one “weak acid” bicarbonate (HCO3) and two “strong acids” sulphate (SO4) and chloride (Cl). Less common anion and cation-constituents are summed with the major three anions and cations as shown in the following table:
Table 1. Major and minor constituents of natural water
To create a graph with the major water constituents, Piper (1994) suggested drawing two triangles corresponding with the cations and anions, respectively, and one diamond that summarize both triangles. The left triangle represents the cations and the right one the anions. The base of the cation triangle is the axis for calcium, the left side for magnesium and the right one for sodium plus potassium. For the anion one, the base is the axis for chloride, the left side for carbonate plus bicarbonate and the right one for sulfate. According to the location of the sample, the hydrochemical facies can be identified. Said facies are the diagnostic chemical aspect of water solutions occurring in hydrologic systems and are explained in the following diagram:
Figure 1a: Hydrochemical facies in the cation and anion triangles and in the diamond.
Figure 1b: Hydrochemical facies in the diamond.
Procedure
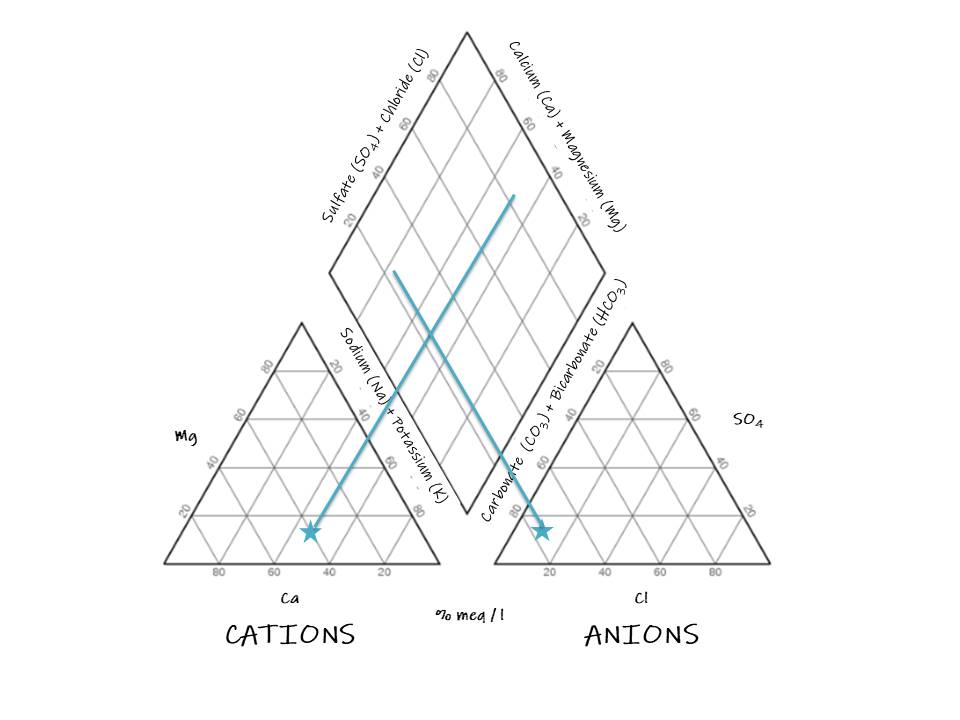
To use the Piper diagram, firstly, the concentration of anions and cations must be placed in the triangles. Then, a perpendicular line must be drawn from the sample point in one triangle to the diamond and repeat it from the other triangle. Let’s look at the following example.
The characteristics of the sample are as follows:
1. Locate the point in the cation triangle:
2. Locate the sample in the anion triangle:
3. Draw a perpendicular line toward the diamond from the sample point in the cation triangle:
4. Draw a perpendicular line toward the diamond from the sample point in the anion triangle:
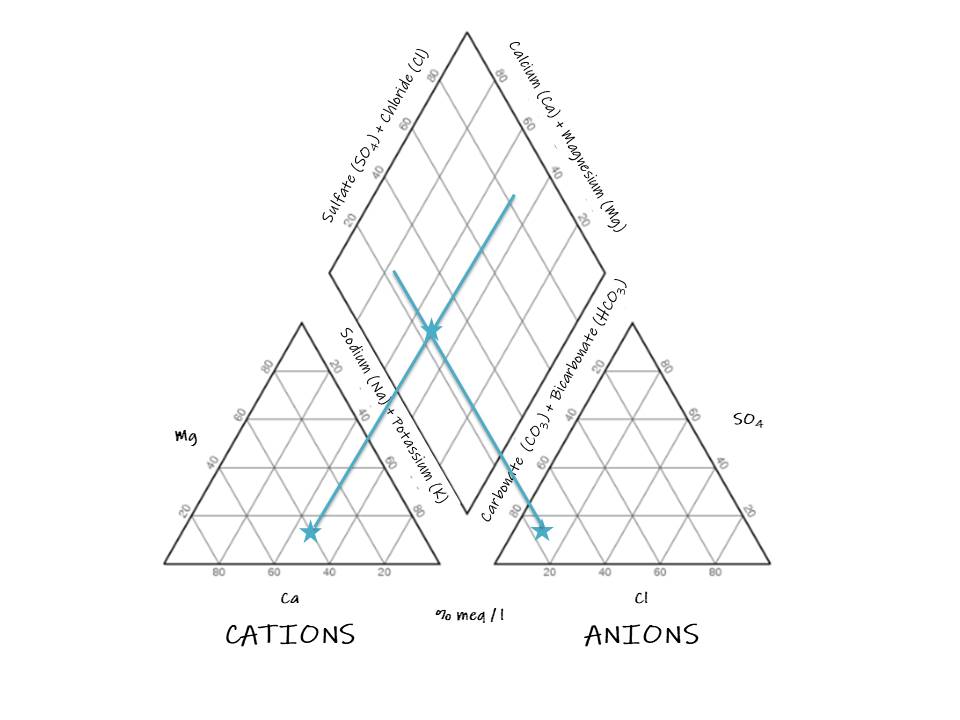
5. Draw a point in the intersection of the perpendicular lines:
Analysis
Now, we can interpret the hydrochemical facies:
The sample does not present a dominant cation type, it definitely corresponds with the bicarbonate type and can be a magnesium bicarbonate type or a mixed type.
The sample demonstrates that weak acids exceed strong acids.
And we can determine from the graph that alkaline earths exceed alkalies in this sample. Although the diagram is effective, many problems need to be answered by intensive studies of critical analytical data by other methods (Piper 1944).
Online Piper diagrams
Hatarilabs offer you a online app to create your own Piper diagrams, if you want to learn more about it go to https://www.hatarilabs.com/ih-en/online-representation-of-piper-schoeller-and-stiff-diagrams-with-hatarichem-tutorial
References
Piper, A.M., 1944. A graphic procedure in the geochemical interpretation of water-analyses. Eos, Transactions American Geophysical Union, 25(6), pp.914–928.


