Groundwater Quality Analysis with QGIS3 Tutorial - Case Arsenic in California
/Physical process on the surface and underground flow regime are spatially and temporal distributed, therefore the use of GIS software is key to understand the different patterns in groundwater flow and quality and the interaction with surface flow, geology and anthropogenic factors.
Some of the best sources to understand groundwater flow and interaction with water quality are the Toth publications, specially: Gravitational Systems of Groundwater Flow: Theory, Evaluation, Utilization (2009). From the outlined concepts of the book, there is a major need to understand the 2D and even 3D distribution of the recharge and discharge zones, together with chemical components and field parameters to have a feeling of what is going on below surface.
Since groundwater happens in the ground, and the we as humans are incapable to see behind a solid or a porous media, the groundwater flow regime remains one of the most uncertain topics on human wisdom. There aren´t two places with the same groundwater flow characteristics; heterogenity in groundwater flow comes from geology, climate, latitude, land cover and other factors. For every case, a particular analysis have to be done with the available data on the spatial and temporal scale.
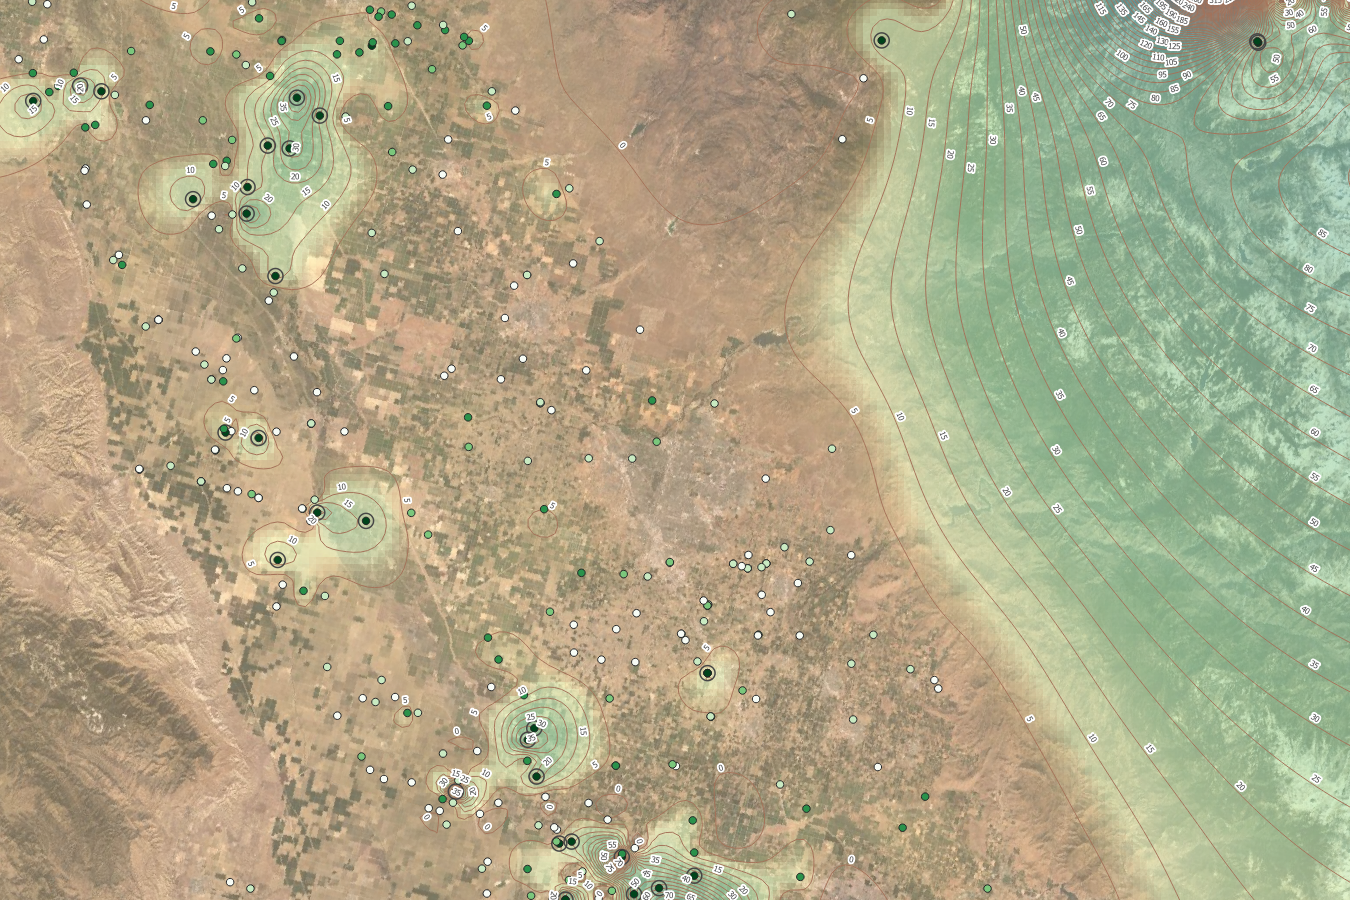
QGIS is a open geographical information system (GIS) software that brings a variety of tools for the thematic spatial representation of the groundwater quality components. This tutorial shows a whole exercise of data preparation, color based representation, ruled based representation of points above standars, spatial interpolation and contour representation.
Chemical dataset and standards
The dataset has 2180 arsenic values, in micrograms per liter, for groundwater samples in California. The samples were compiled by the United States Geological Survey (USGS) between 1973 and 2001. More information about the dataset on this link:
https://catalog.data.gov/dataset/map-of-arsenic-concentrations-in-groundwater-of-the-united-states
Drinking water standards came from the National Primary Drinking Water Regulations (NPDWR). More information on the document on this link:
https://www.epa.gov/wqc/national-recommended-water-quality-criteria-human-health-criteria-table
QGIS tools for groundwater quality representation
There are many tools in QGIS for point feature representation. Here we show some tools for the representation of groundwater quality components on monitoring sites.
Color based component representation
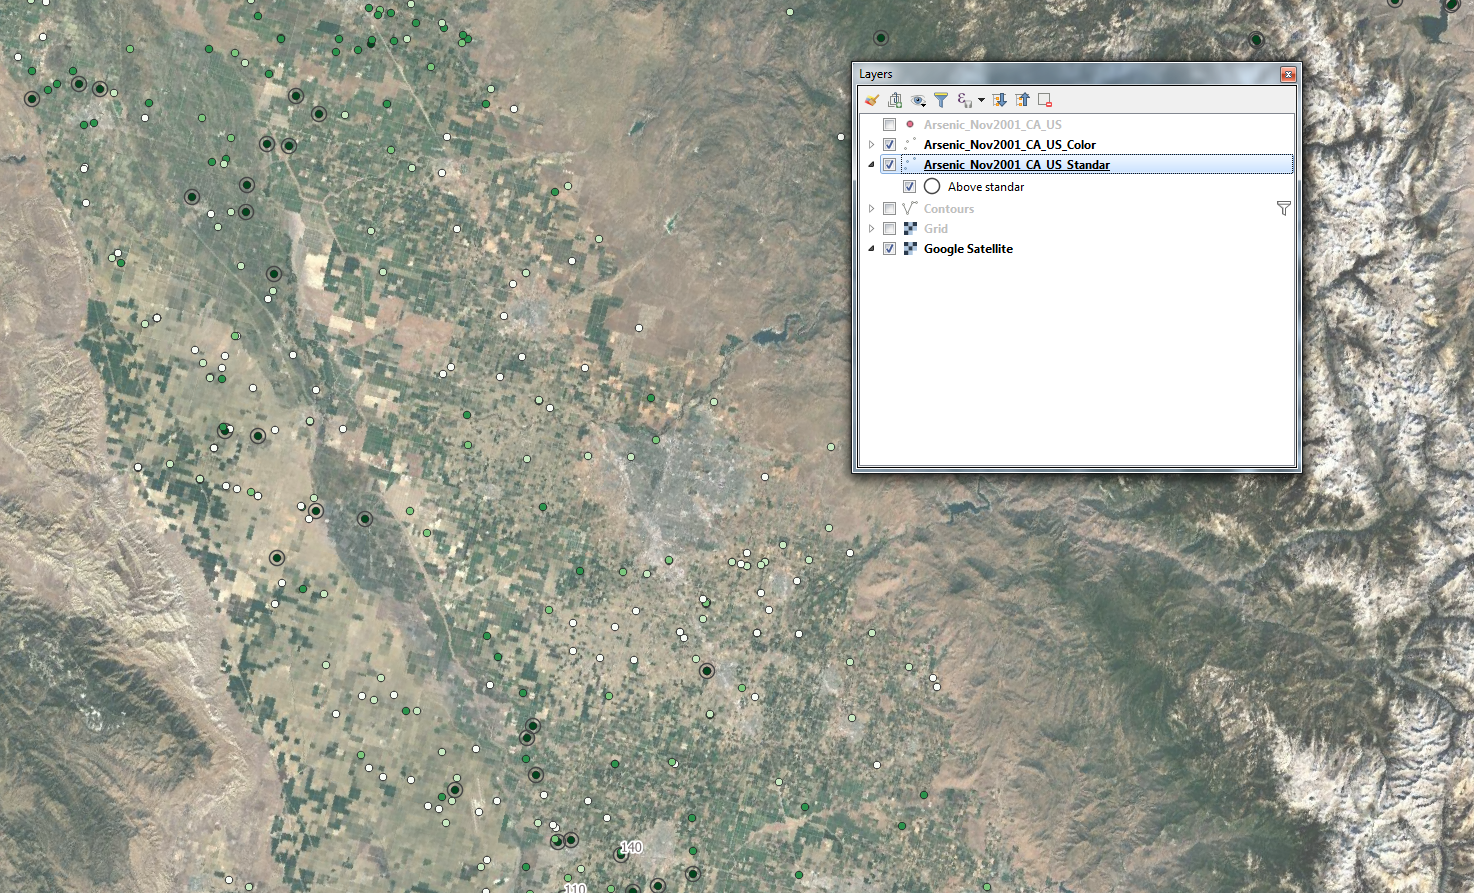
Under Properties/Symbology select Graduated. Dont forget to select a color map and press Classify
Ruled based component representation
Used to represent the arsenic components above the standard. Under Properties/Symbology select Rule-based. Insert a rule by clicking on the green plus bottom, insert the rule name and a expresion that in this case was: “"AS_CONC" > 10“
Spatial interpolation
On Processing select Multilevel b-spline interpolation, select “AS_CONC” as the Attribute and increase the Cellsize to 1000 otherwise the output raster will be huge based on the point region.
Contour representation
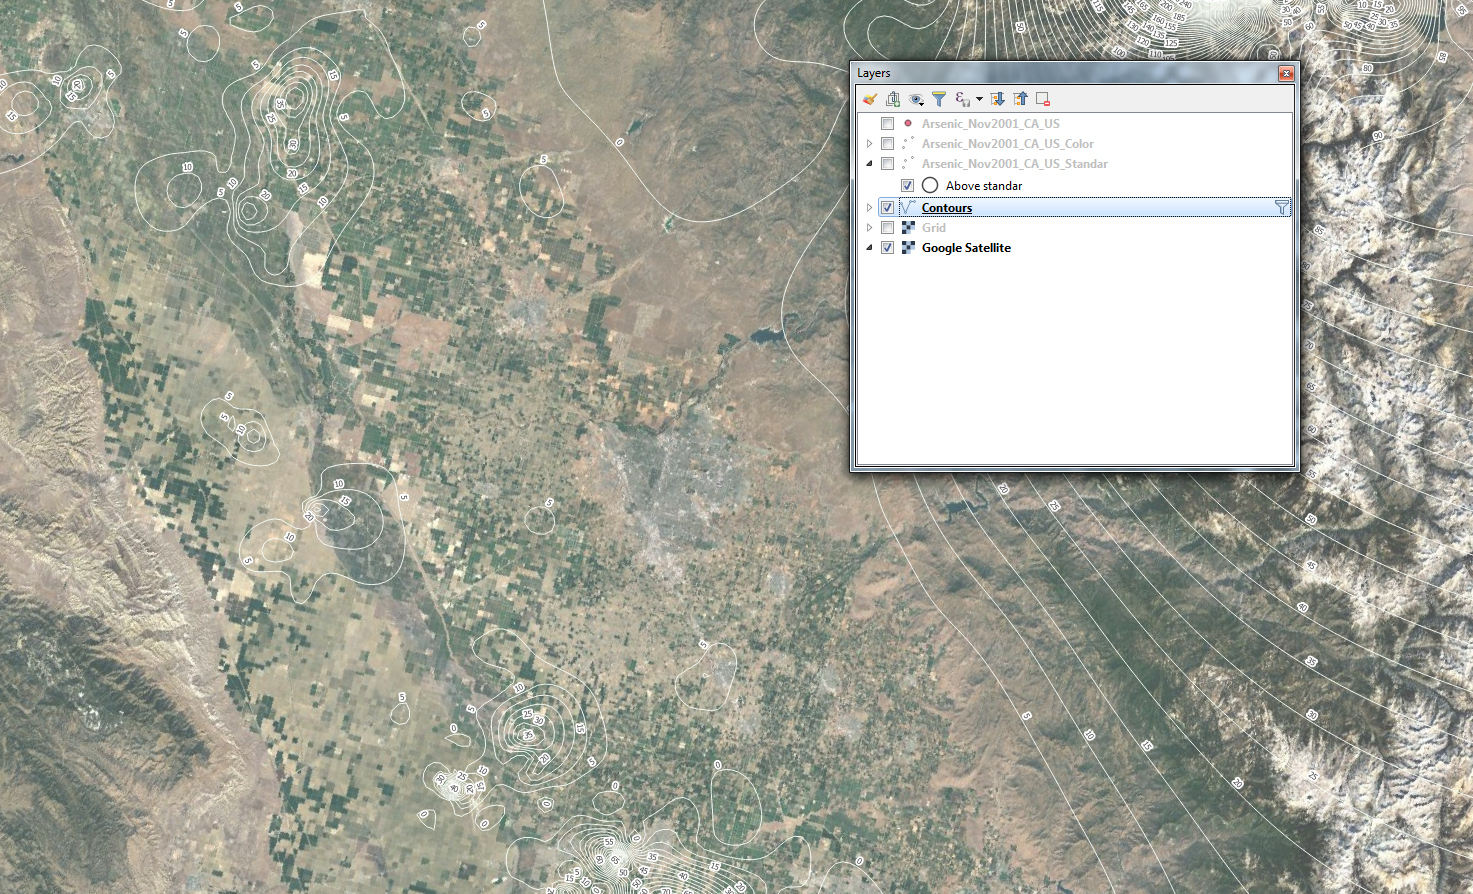
On Processing select Contour. Filter the result for negative values with Filter.. and insert the following expression: "ELEV" >= 0. You can use a gradient representation of contour lines with the concentration value and insert some labels.
Tutorial
Input data
You can download the input data for this tutorial here.


