How to create a point/line/polygon shapefile with Python and Fiona - Tutorial
/
Storage, management and analysis of geospatial vector data as an ESRI shapefile is a common procedure of GIS and related professionals. The generation of these spatial files can be done not only on a desktop software but also by Python commands. We have created an applied example that shows the procedure in Python to create point, line, and polygon shapefiles from a csv file by the use of the Fiona library.
If you are a Windows user, it is recommended to have Fiona and other geospatial libraries installed under a Conda environment following this tutorial.
Tutorial
Python code
#import requires packages
import fiona
import pandas as pd
Create point shapefile
#import points from csv file
pointDf = pd.read_csv('../Txt//cropPoints.csv',header=0)
pointDf.head()| X | Y | Name | |
|---|---|---|---|
| 0 | -84.200969 | 9.480966 | Plant1 |
| 1 | -84.200841 | 9.480931 | Plant2 |
| 2 | -84.201841 | 9.481167 | Plant3 |
| 3 | -84.200862 | 9.479898 | Plant4 |
| 4 | -84.200657 | 9.479586 | Plant5 |
# define schema
schema = {
    'geometry':'Point',
    'properties':[('Name','str')]
}
# explore available drivers
fiona.supported_drivers{'AeronavFAA': 'r',
'ARCGEN': 'r',
'BNA': 'rw',
'DXF': 'rw',
'CSV': 'raw',
'OpenFileGDB': 'r',
'ESRIJSON': 'r',
'ESRI Shapefile': 'raw',
'FlatGeobuf': 'rw',
'GeoJSON': 'raw',
'GeoJSONSeq': 'rw',
'GPKG': 'raw',
'GML': 'rw',
'OGR_GMT': 'rw',
'GPX': 'rw',
'GPSTrackMaker': 'rw',
'Idrisi': 'r',
'MapInfo File': 'raw',
'DGN': 'raw',
'PCIDSK': 'rw',
'OGR_PDS': 'r',
'S57': 'r',
'SEGY': 'r',
'SQLite': 'raw',
'SUA': 'r',
'TopoJSON': 'r'}#structure of fiona object
fiona.open( fp, mode='r', driver=None, schema=None, crs=None, encoding=None, layer=None, vfs=None, enabled_drivers=None, crs_wkt=None, **kwargs, )
#open a fiona object
pointShp = fiona.open('../ShapeOut/cropPoints.shp', mode='w', driver='ESRI Shapefile',
          schema = schema, crs = "EPSG:4326")
#iterate over each row in the dataframe and save record
for index, row in pointDf.iterrows():
rowDict = {
'geometry' : {'type':'Point',
'coordinates': (row.X,row.Y)},
'properties': {'Name' : row.Name},
}
pointShp.write(rowDict)
#close fiona object
pointShp.close()Create line shapefile
#import line vertex from csv file
lineDf = pd.read_csv('../Txt/cropLine.csv',header=0)
lineDf.head()| X | Y | Name | |
|---|---|---|---|
| 0 | -84.201990 | 9.480380 | Row1 |
| 1 | -84.201928 | 9.480319 | Row1 |
| 2 | -84.201871 | 9.480261 | Row1 |
| 3 | -84.201820 | 9.480199 | Row1 |
| 4 | -84.201756 | 9.480133 | Row1 |
# define schema
schema = {
    'geometry':'LineString',
    'properties':[('Name','str')]
}
#open a fiona object
lineShp = fiona.open('../ShapeOut/cropLine.shp', mode='w', driver='ESRI Shapefile',
schema = schema, crs = "EPSG:4326")#get list of points
xyList = []
rowName = ''
for index, row in lineDf.iterrows():
xyList.append((row.X,row.Y))
rowName = row.Name
xyList[:5][(-84.2019904893069, 9.48038022019686),
(-84.2019279965972, 9.48031926246447),
(-84.2018711206848, 9.48026145133191),
(-84.2018196550243, 9.48019910289781),
(-84.2017559092017, 9.48013268586072)]#save record and close shapefile
rowDict = {
'geometry' : {'type':'LineString',
'coordinates': xyList},
'properties': {'Name' : rowName},
}
lineShp.write(rowDict)
#close fiona object
lineShp.close()Create polygon shapefile
#import line vertex from csv file
polyDf = pd.read_csv('../Txt/cropPoly.csv',header=0)
polyDf.head()| X | Y | Name | |
|---|---|---|---|
| 0 | -84.202396 | 9.480334 | Border1 |
| 1 | -84.202190 | 9.480555 | Border1 |
| 2 | -84.201886 | 9.480792 | Border1 |
| 3 | -84.201529 | 9.481153 | Border1 |
| 4 | -84.201307 | 9.481303 | Border1 |
#show the last item
polyDf.tail()| X | Y | Name | |
|---|---|---|---|
| 19 | -84.201742 | 9.479385 | Border1 |
| 20 | -84.201863 | 9.479413 | Border1 |
| 21 | -84.202157 | 9.479673 | Border1 |
| 22 | -84.202398 | 9.479917 | Border1 |
| 23 | -84.202396 | 9.480334 | Border1 |
# define schema
schema = {
    'geometry':'Polygon',
    'properties':[('Name','str')]
}
#open a fiona object
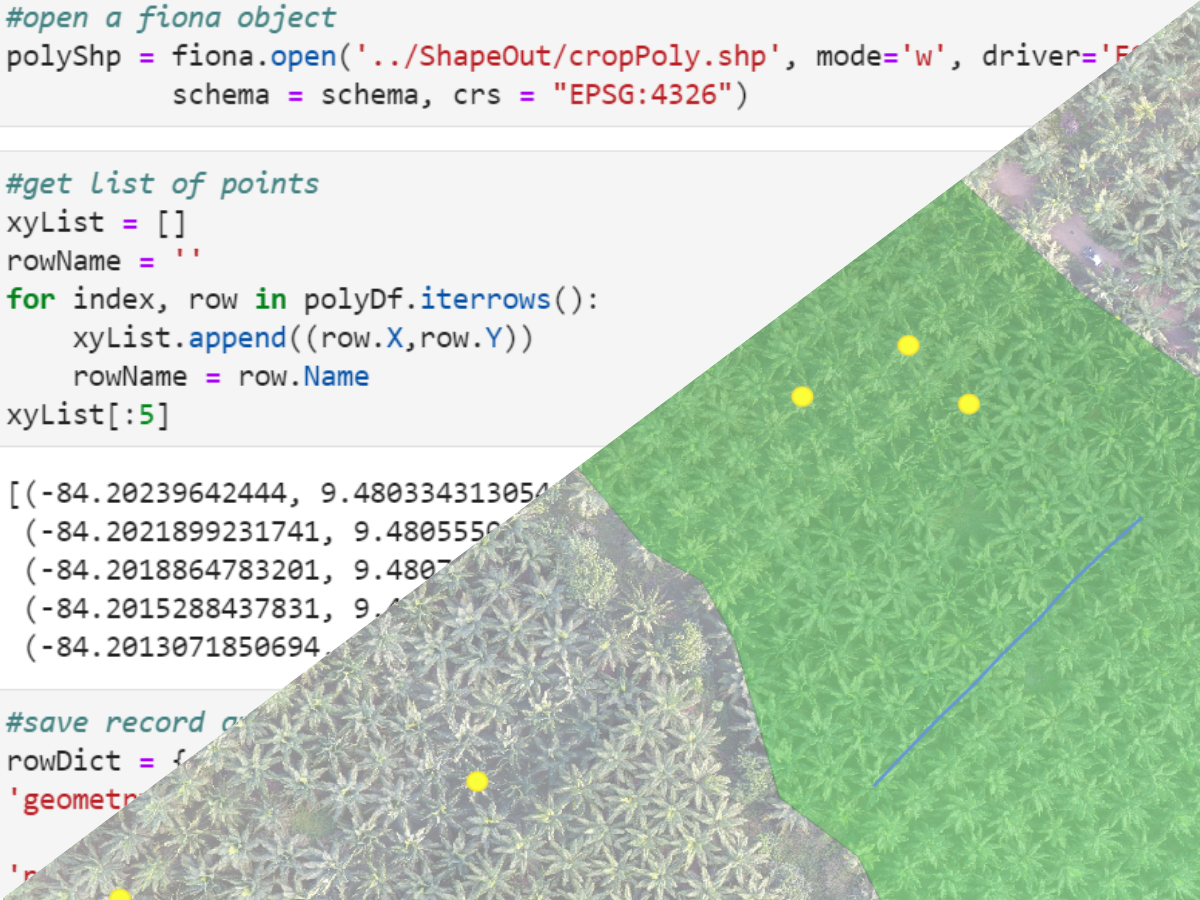
polyShp = fiona.open('../ShapeOut/cropPoly.shp', mode='w', driver='ESRI Shapefile',
schema = schema, crs = "EPSG:4326")#get list of points
xyList = []
rowName = ''
for index, row in polyDf.iterrows():
xyList.append((row.X,row.Y))
rowName = row.Name
xyList[:5][(-84.20239642444, 9.48033431305493),
(-84.2021899231741, 9.48055508704213),
(-84.2018864783201, 9.48079161161365),
(-84.2015288437831, 9.48115260231102),
(-84.2013071850694, 9.4813034753504)]#save record and close shapefile
rowDict = {
'geometry' : {'type':'Polygon',
'coordinates': [xyList]}, #Here the xyList is in brackets
'properties': {'Name' : rowName},
}
polyShp.write(rowDict)
#close fiona object
polyShp.close()Input data
You can download the input data from this link.