How to make a geological map with QGIS - Tutorial
/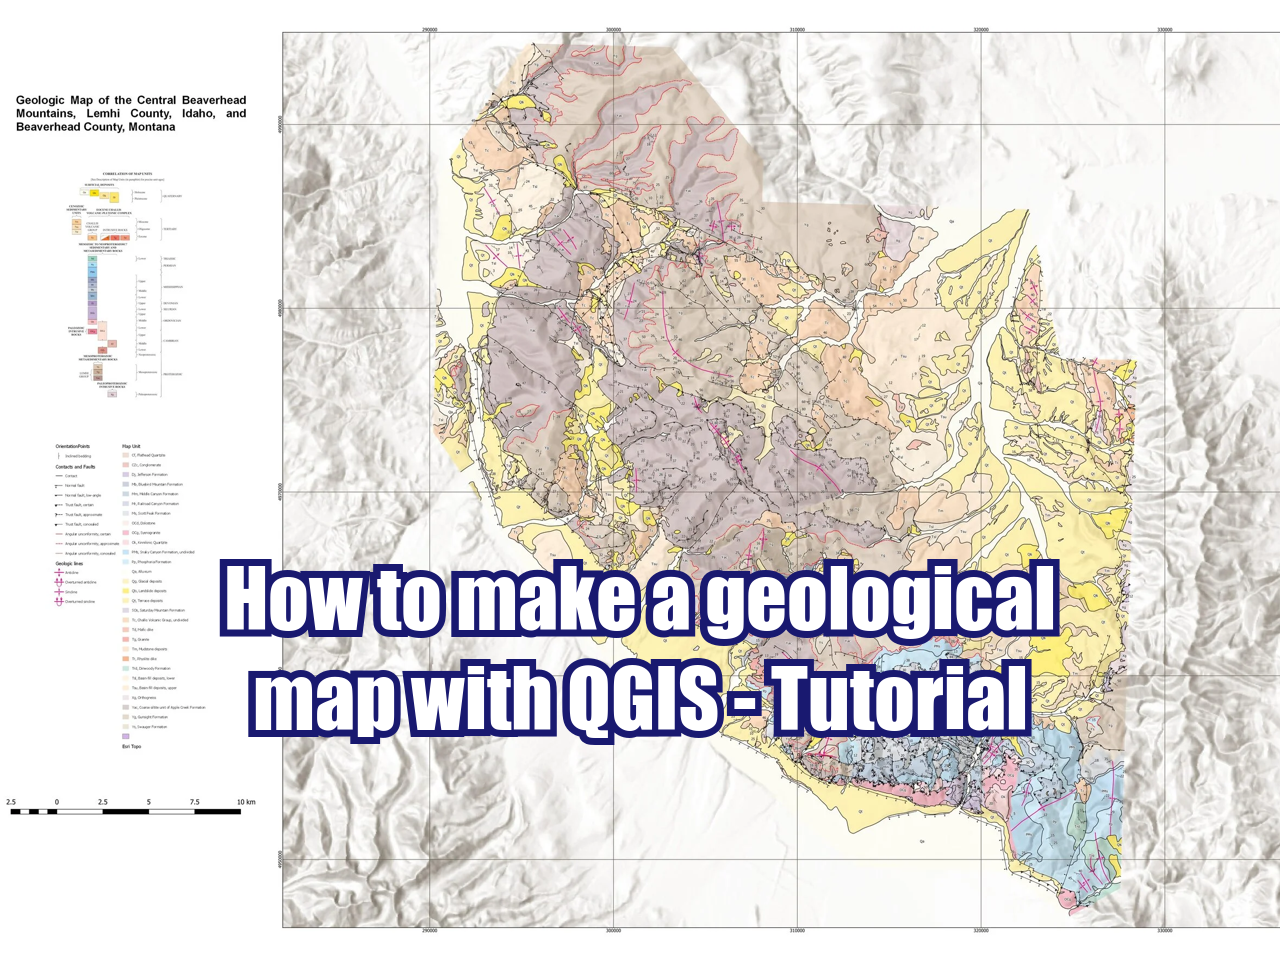
A good spatial representation of the geological features requires not only high quality field data but also the right symbology and graphical resources. We can define QGIS as the tool that can create awesome geologic maps but still some resources have to be developed for a massive use. We have explored some QGIS tools related to the representation of geological units and developed symbology to represent geological contacts, faults and other geological features.
This tutorial deals with the representation of geological information at regional scale from the Central Beaverhead Mountains, Idaho, US and creates a geological map through a series of processing and representation steps as:
Applying styles to geological units
Representation of contacts and normal / thrust faults
Representation of inclined beddings
Representation of anticlines / synclines
Map composition with legend, scale bar, grid and external graphs
The tutorial is based on a webinar given on April 27, 2021
Tutorial
Input data
You can download the input data from this link.