How to make a wind rose with Python - Tutorial
/How to make a wind rose online with Hatari Utils - Tutorial
hatarilabs.com/ih-en/how-to-make-a-wind-rose-online-with-hatari-utils-tutorial
Python is a useful tool for data analysis but also for data representation and as a graphic tool. This is an applied tutorial for the representation of a wind rose with Python from wind speed and direction stored on an Excel spreadsheet. The tutorial explores the options of the library to represent windroses as bars, boxes, polygons or contours.
Homepage of the windrose library:
https://github.com/python-windrose/windrose
Input data
You can download the input data from this link.
Tutorial
Code
This is the Python code for the tutorial:
# Import the required packages
%matplotlib inline
import pandas as pd
import numpy as np
from matplotlib import pyplot as plt
import matplotlib.cm as cm
from math import pi
# Uncomment the following line in case you are missing those packages
# !pip install windrose openpyxl
from windrose import WindroseAxesOpen wind data from a Excel file
df = pd.read_excel('../Xls/Datos_Rosa_de_Vientos.xlsx')df| ID | VELOCIDAD | DIRECCARD | DIRECCION | |
|---|---|---|---|---|
| 0 | E-01 | 1.3 | SSW | 202.5 |
| 1 | E-01 | 1.3 | SSW | 202.5 |
| 2 | E-01 | 1.3 | SSW | 202.5 |
| 3 | E-01 | 1.3 | SSW | 202.5 |
| 4 | E-01 | 2.2 | SSE | 157.5 |
| 5 | E-01 | 1.8 | SSE | 157.5 |
| 6 | E-01 | 2.2 | SSE | 157.5 |
| 7 | E-01 | 3.1 | SE | 135.0 |
| 8 | E-01 | 2.7 | SE | 135.0 |
| 9 | E-01 | 2.2 | SE | 135.0 |
| 10 | E-01 | 2.2 | ESE | 112.5 |
| 11 | E-01 | 1.5 | S | 180.0 |
| 12 | E-01 | 2.2 | ESE | 112.5 |
| 13 | E-01 | 1.8 | ESE | 112.5 |
| 14 | E-01 | 1.8 | SE | 135.0 |
| 15 | E-01 | 2.2 | S | 180.0 |
| 16 | E-01 | 2.7 | SE | 135.0 |
| 17 | E-01 | 2.2 | SE | 135.0 |
| 18 | E-01 | 1.3 | SE | 135.0 |
| 19 | E-01 | 0.9 | S | 180.0 |
| 20 | E-01 | 1.8 | SE | 135.0 |
| 21 | E-01 | 1.8 | ESE | 112.5 |
| 22 | E-01 | 1.3 | SE | 135.0 |
| 23 | E-01 | 1.3 | S | 180.0 |
| 24 | E-01 | 0.9 | SE | 135.0 |
| 25 | E-01 | 0.9 | SSE | 157.5 |
| 26 | E-01 | 0.9 | SE | 135.0 |
| 27 | E-01 | 1.1 | SSE | 157.5 |
Representation of wind speed on the x and y axis
df['velocidad_x'] = df['VELOCIDAD'] * np.sin(df['DIRECCION'] * pi / 180.0)
df['velocidad_y'] = df['VELOCIDAD'] * np.cos(df['DIRECCION'] * pi / 180.0)
fig, ax = plt.subplots(figsize=(8, 8), dpi=80)
x0, x1 = ax.get_xlim()
y0, y1 = ax.get_ylim()
ax.set_aspect('equal')
df.plot(kind='scatter', x='velocidad_x', y='velocidad_y', alpha=0.35, ax=ax)
<AxesSubplot:xlabel='velocidad_x', ylabel='velocidad_y'>Histogram of wind speed
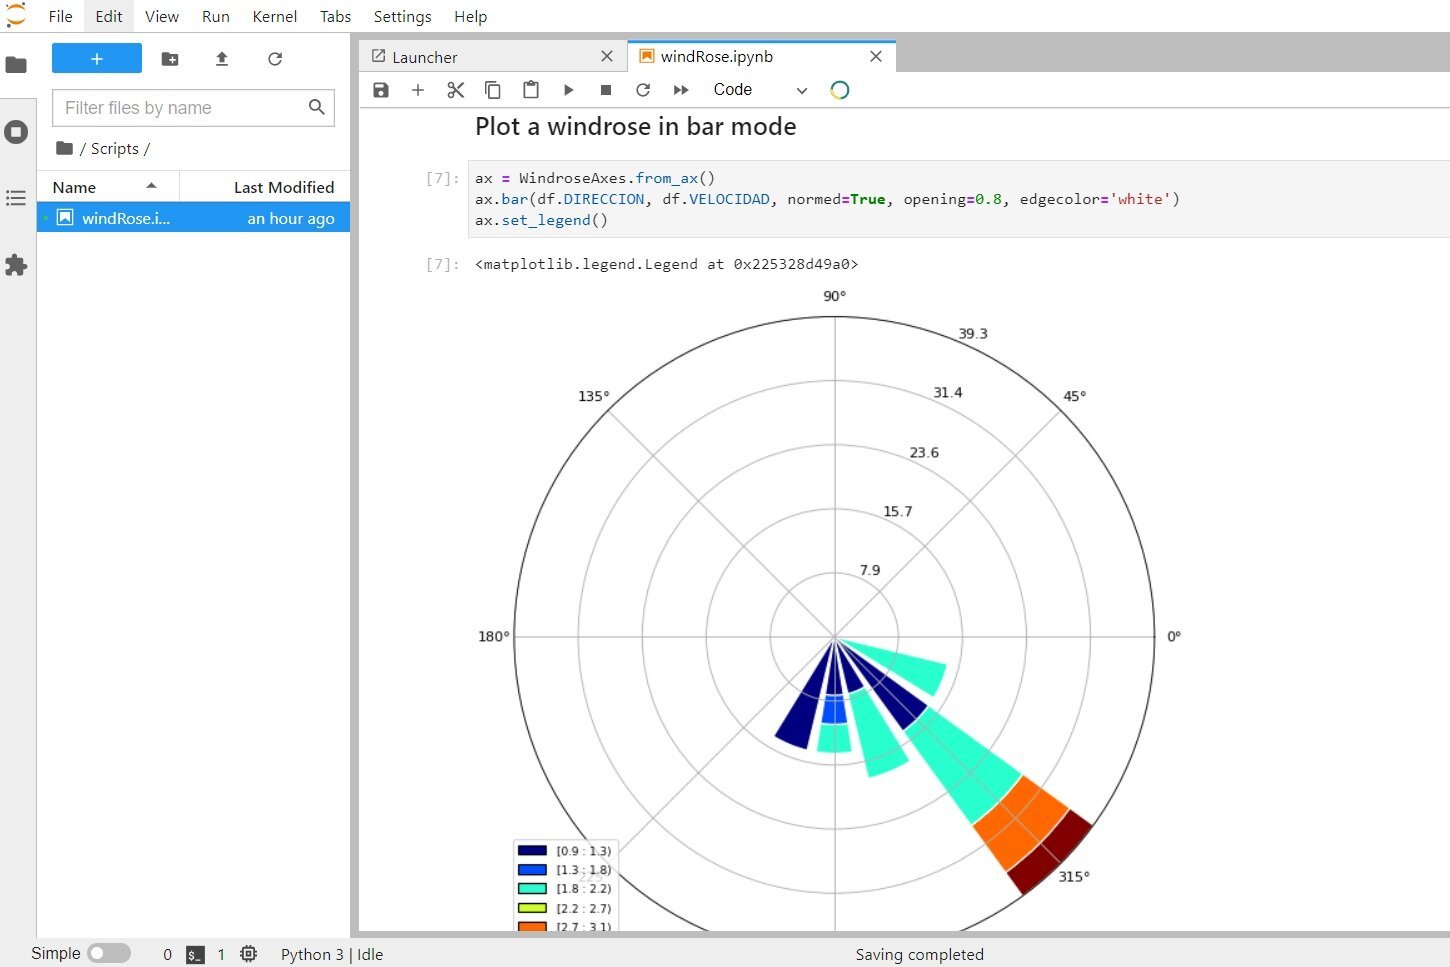
df['VELOCIDAD'].hist(figsize=(10,6))<AxesSubplot:>Plot a windrose in bar mode
ax = WindroseAxes.from_ax()
ax.bar(df.DIRECCION, df.VELOCIDAD, normed=True, opening=0.8, edgecolor='white')
ax.set_legend()
<matplotlib.legend.Legend at 0x225328d49a0>Plot a windrose in proportional box mode.
ax = WindroseAxes.from_ax()
ax.box(df.DIRECCION, df.VELOCIDAD, bins=np.arange(0, 8, 1))
ax.set_legend()
<matplotlib.legend.Legend at 0x22532a32430>Plot a windrose in filled mode
ax = WindroseAxes.from_ax()
ax.contourf(df.DIRECCION, df.VELOCIDAD, bins=np.arange(0, 8, 1), cmap=cm.hot)
ax.set_legend()
<matplotlib.legend.Legend at 0x22532ae8790>Plot a windrose in linear mode
ax = WindroseAxes.from_ax()
ax.contour(df.DIRECCION, df.VELOCIDAD, bins=np.arange(0, 8, 1), cmap=cm.hot, lw=3)
ax.set_legend()
<matplotlib.legend.Legend at 0x22532b58880>


