Introducing Hataripy, the unofficial Flopy version that creates awesome VTKs
/The most promising future of groundwater resources could rely heavily on the social media and social networks as platforms of massive diffusion, quick interaction and raising awareness. However, to participate in this new trend our evaluations need to be in another level of powerful text, nice charts and awesome 3D graphics.
For us, the advanced visualization of groundwater flow and transport is considered a key point on our evaluations. We don’t know if groundwater visualization can be considered a science although we doubt if a scientific paper of groundwater graphics can be eligible for a hydrogeologist conference or a indexed journal in hydrogeology. However, unless that you can motivate the stakeholders with finite differences or uncertainty analysis, you will need powerful (and of course accurate) graphics that ensure the concept appropriation of the main characteristics of groundwater flow and quality or any related topic that your investigation deals with.
A new unofficial version of the Flopy is available as Hataripy. This “fork” has tools for the representation of many features, boundary conditions and output with options for grid smoothing. Documentation for this library is on progress as we expect to introduce other features and identify some bugs.
Currently the library can:
Create the model mesh on the active zone with point and cell values
Create a shell of the water table
Create the geometry of any boundary condition
Installation
You can install the library by typing this line on the Anaconda Prompt if your are in Windows or in the Shell of Linux:
pip install -i https://test.pypi.org/simple/ hataripy
Example
In order to do this code, please download the files from this link, uncompress them under your “Documents” folder and create a new notebook of the “Scripts” folder. The script will locate the model files and generate the VTU files on the specified address. A description of the code can be seen on this video.
Import packages define paths and load model
import os, re, sys, hataripy
import numpy as np
hataripy is installed in E:\Software\Anaconda3\lib\site-packages\hataripymodPath = '../Model/'
modName = 'Model1'
exeName = '../Exe/MODFLOW-NWT_64.exe'
mfModel = hataripy.modflow.Modflow.load(modName+'.nam', model_ws=modPath,
exe_name=exeName)# get a list of the model packages
mfModel.get_package_list()['DIS', 'NWT', 'BAS6', 'UPW', 'RCH', 'EVT', 'DRN', 'OC']Define objects that will be represented on the VTKs and add them to geometry object
# read heads from the model output
headArray = hataripy.utils.binaryfile.HeadFile(modPath+modName+'.hds').get_data()
# get information about the drain cells
drnCells = mfModel.drn.stress_period_data[0]
# add the arrays to the vtkObject
vtkObject = hataripy.export.vtk.Vtk3D(mfModel,'../vtuFiles/',verbose=True)
vtkObject.add_array('head',headArray)
vtkObject.add_array('drn',drnCells)Create the VTKs for model output, boundary conditions and water table
vtkObject.modelMesh('modelMesh.vtu',smooth=True,cellvalues=['head'])
vtkObject.modelMesh('modelDrn.vtu',smooth=True,cellvalues=['drn'],boundary='drn',avoidpoint=True)
vtkObject.waterTable('waterTable.vtu',smooth=True)
Removing existing vtk file: modelMesh.vtu
Writing vtk file: modelMesh.vtu
Number of point is 255920, Number of cells is 31990
Removing existing vtk file: modelDrn.vtu
Writing vtk file: modelDrn.vtu
Number of point is 7432, Number of cells is 929
Removing existing vtk file: waterTable.vtu
Writing vtk file: waterTable.vtu
Number of point is 25592, Number of cells is 6398Processing of the VTKs in Paraview can be seen on this video:
Photo gallery
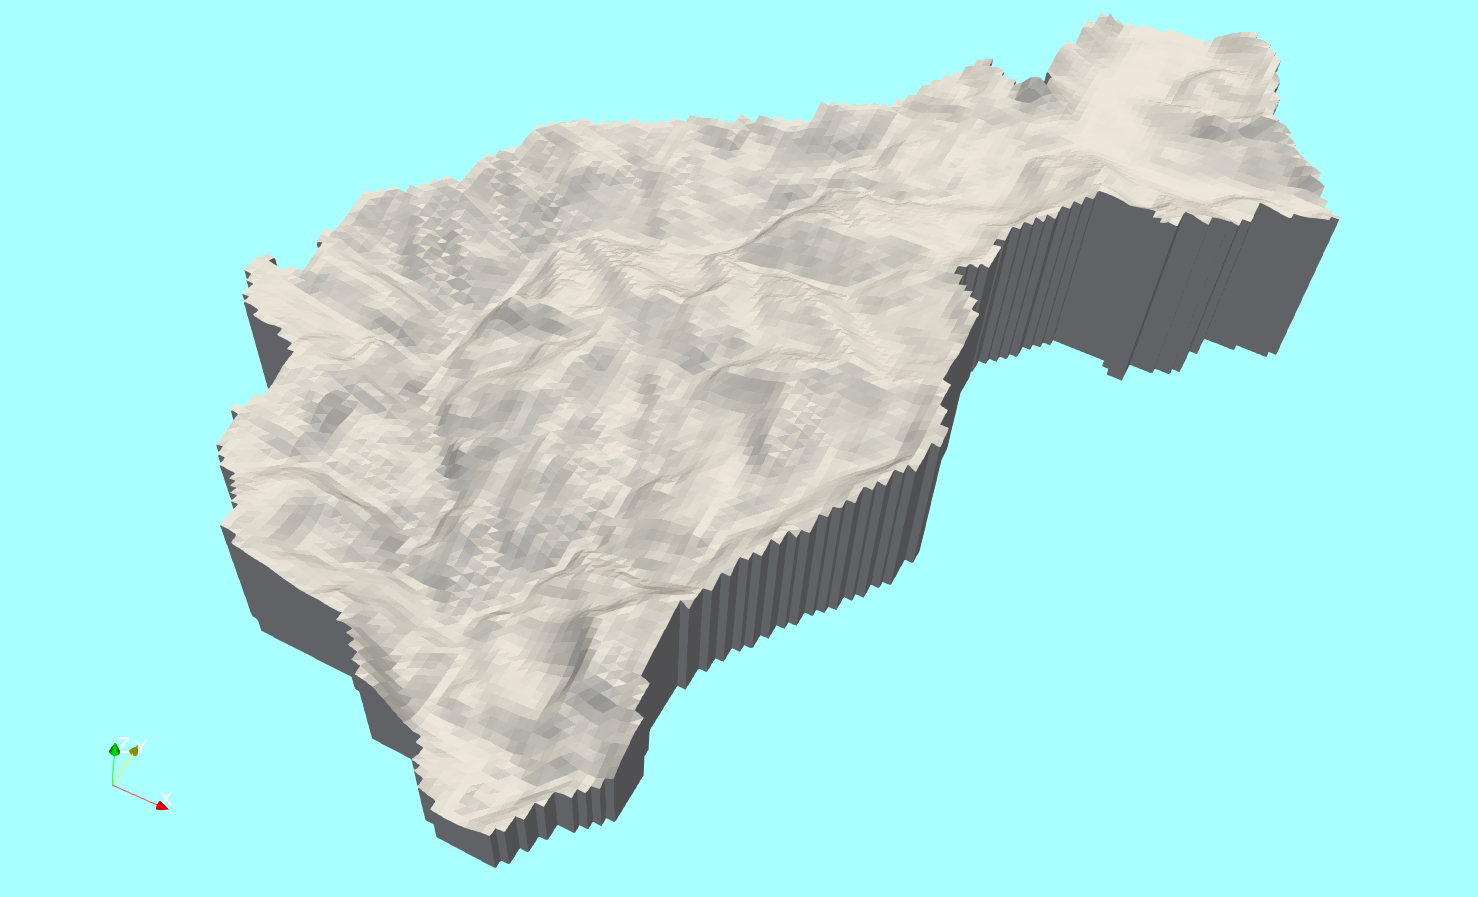
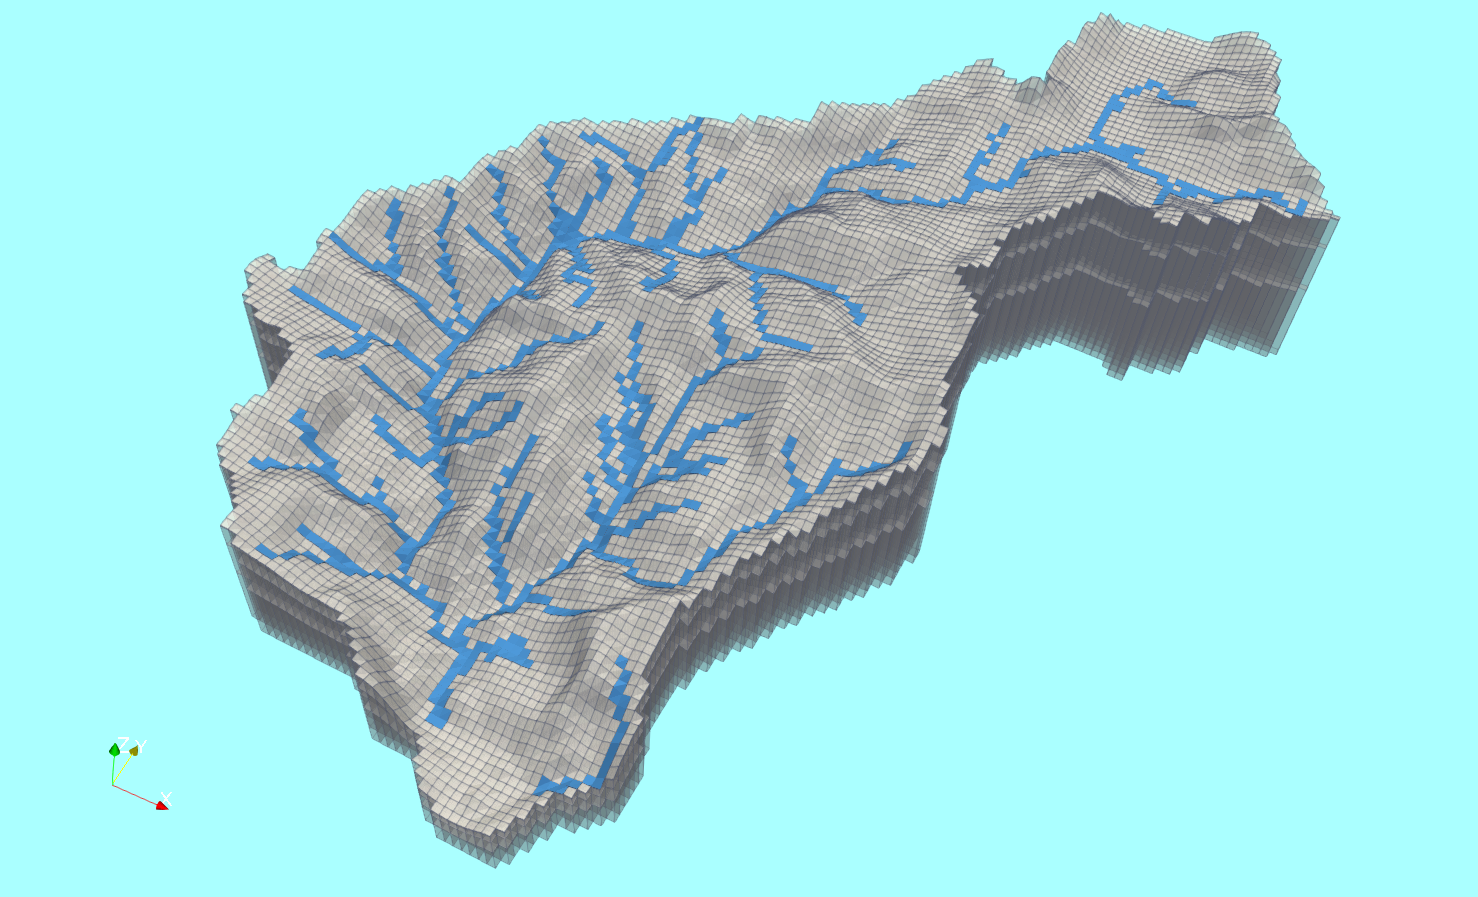
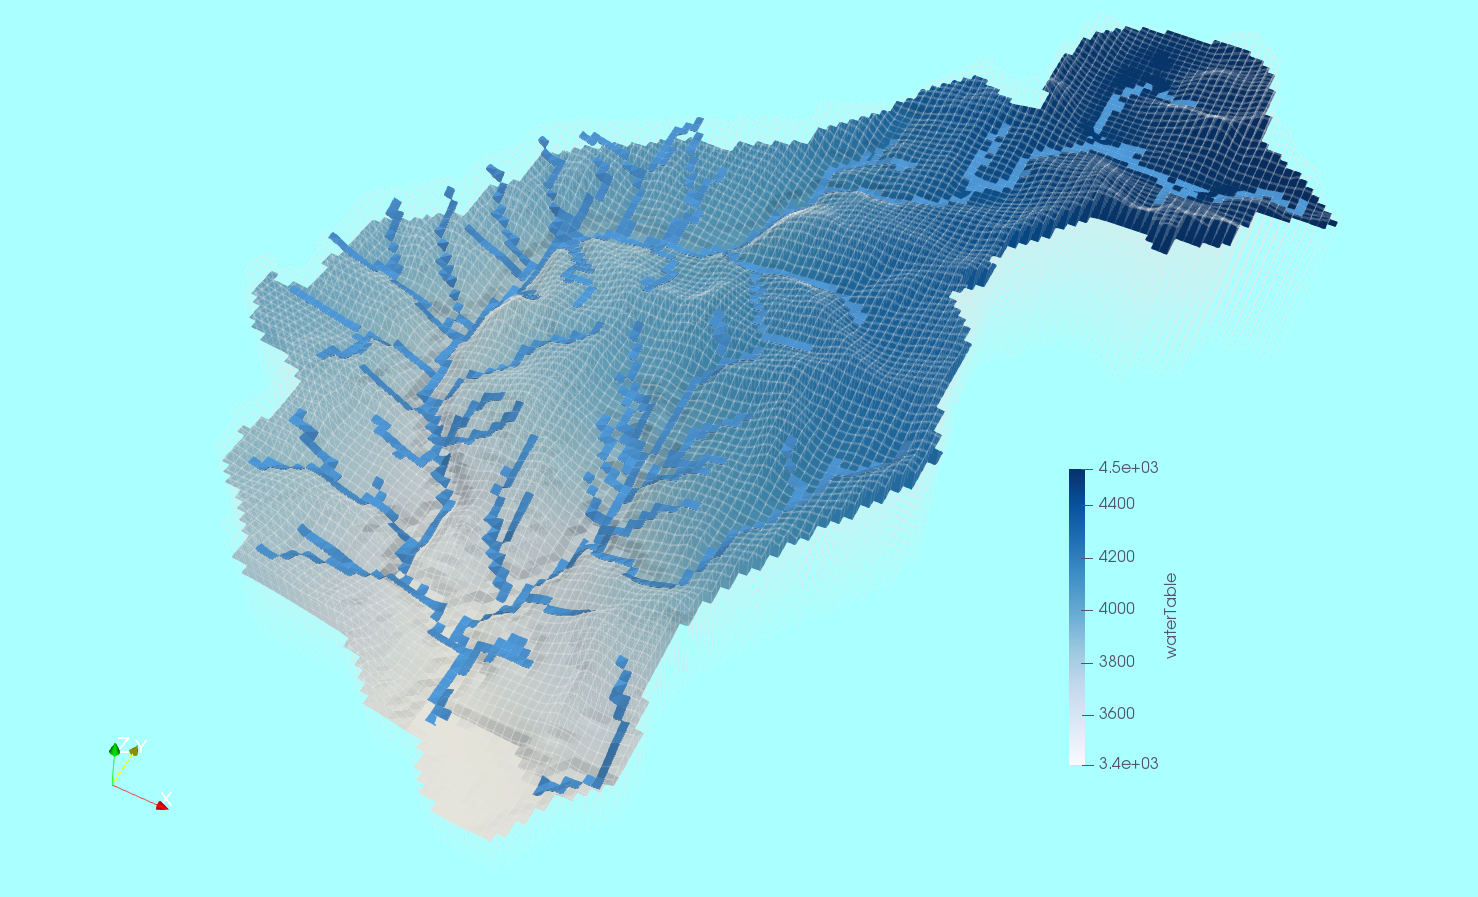
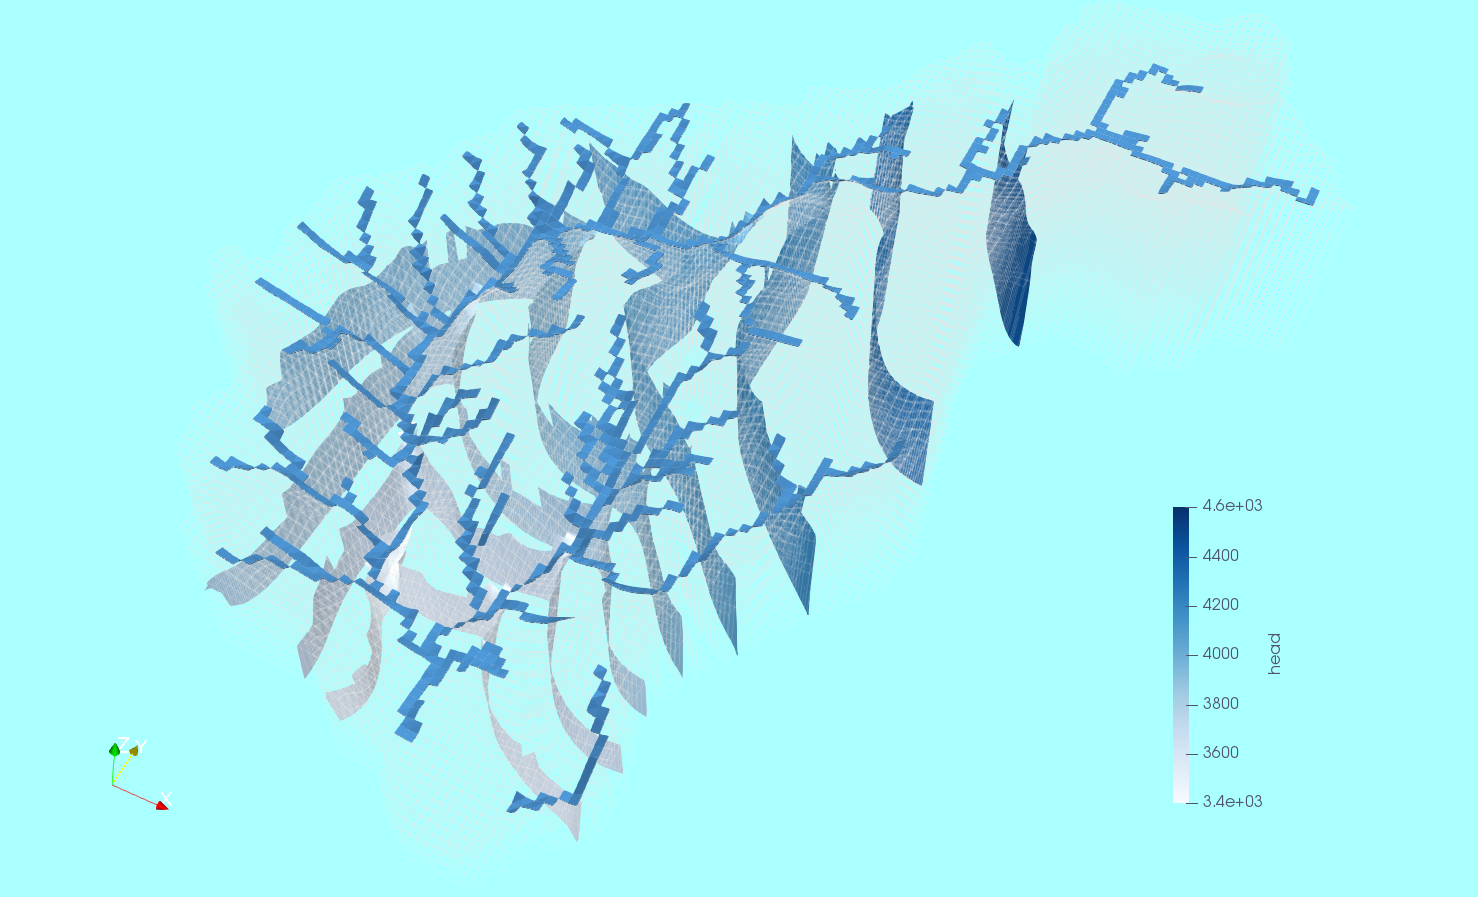
This is a selection of some model graphics done from the VTU files with Paraview.


