Some questions of data visualization in Model Muse
/Hi Saul, I am Giuseppe and I watched your lessons on ModelMuse on YouTube. I’m trying to learn how to use that software, maybe you can help me if you have time.
First thing: in “Data Visualization”, which is the difference between the display of the “3D Data” and “Water Table”? I have the view from the top of the water table, but how do I see the profile of the water table in the side view? If I use, instead, “3D Data” visualization I get different results from those of the water table but I can not interpret them, what do they represent?
Answer: 3D data is the whole data by layer, whereas “Water Table” is the data of the most active cell.
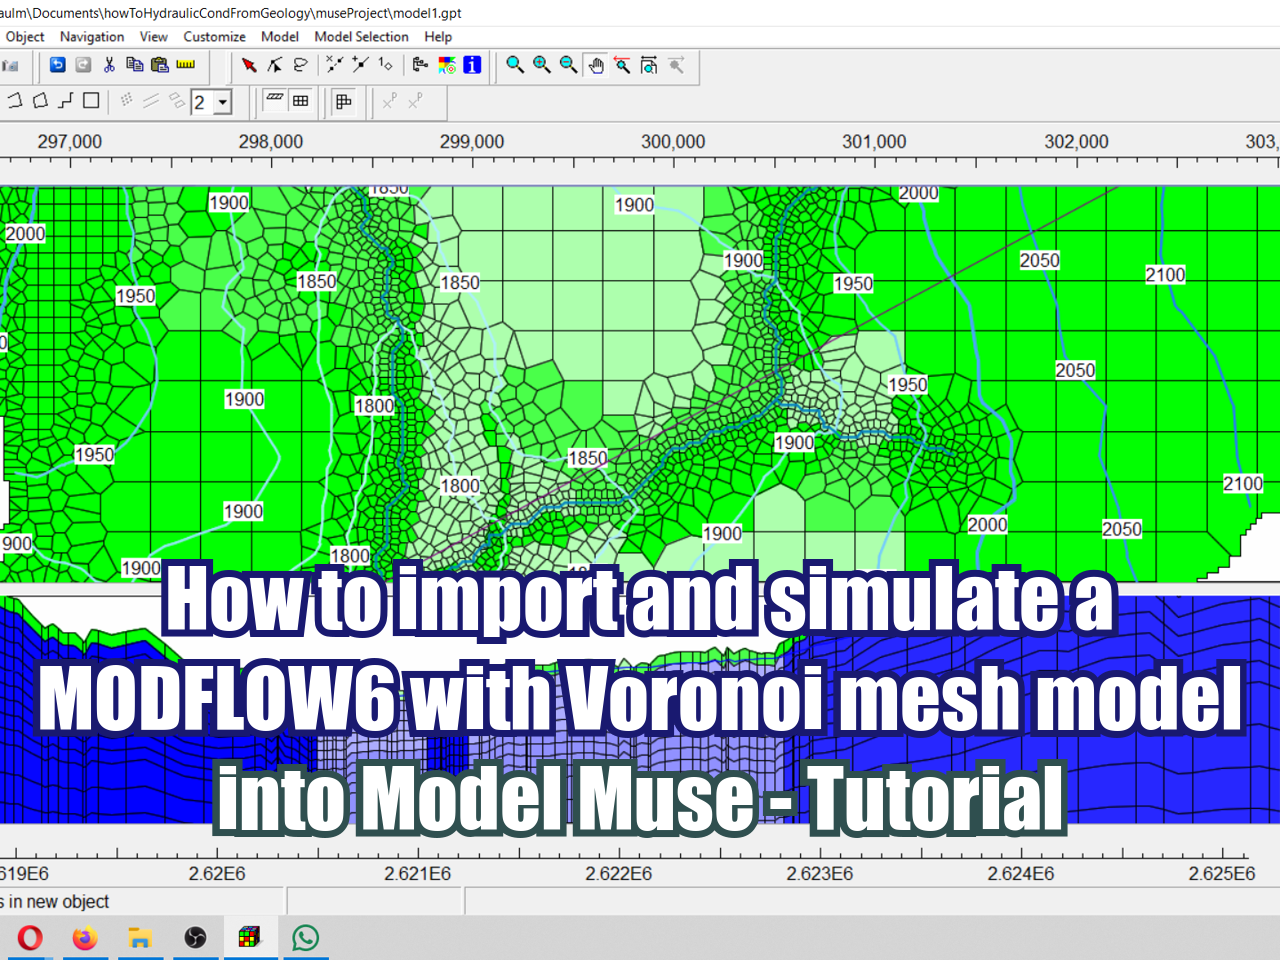
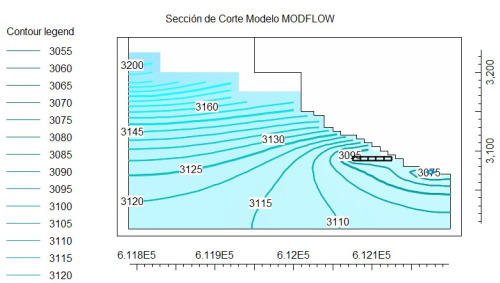
Regarding the display of the water table in cross section view, it is, indeed, possible in ModelMuse. First, you import the calculated heads and then select “Data|Data Visualization”. On the Cross Sections pane, you shall select the water table as the data set to plot.
Another question: is it possible to model a multiaquifer? I mean, if I have two aquifers at different pressures and separated by an aquitard, how do I tell the software that in the same point I have two different piezometric levels?
Answer: If you want to model an aquitard on LPF (flow package as default) you should define the layer as “Non-simulated”. It may be confusing as this option only means that the hydrogeological unit can only have flow perpendicular to the plane, similar to the hydrogeological behaviour of a aquitard.