

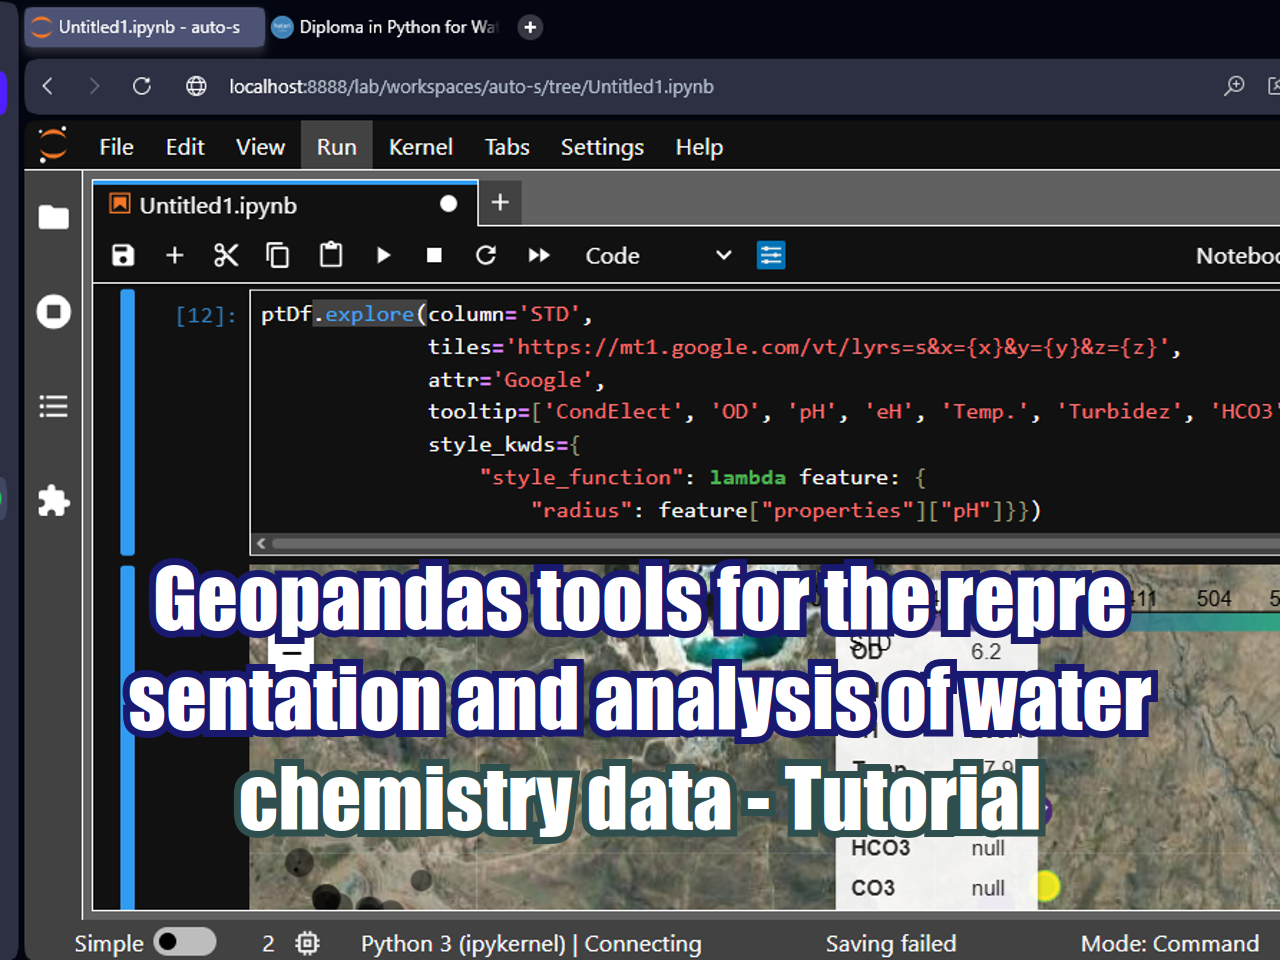
Tutorial to plot water chemistry data on QGIS
/
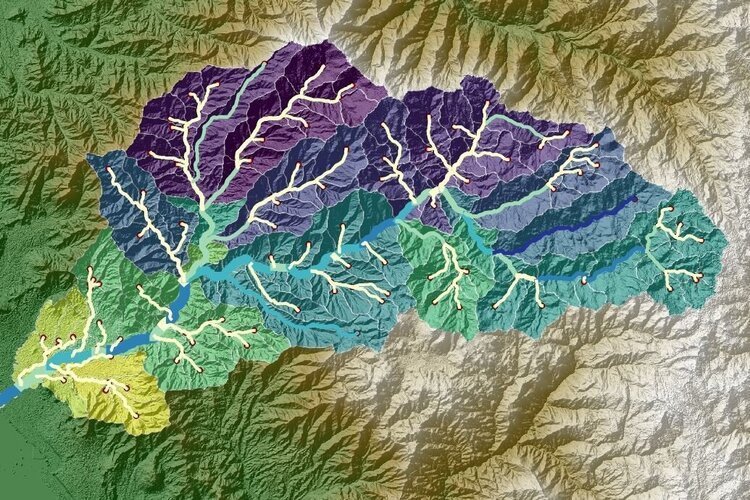
Quick tutorial to plot concentrations, generate contours and make ilustrations.
Main tasks on this tutorial:
- Plot Bicarbonate
- Plot Sulphates - scaled
- Tringular interpolation of Sulphates
- Sulphates concentration contours
- Export ilustration
Download the input and output data for this tutorial:
http://gidahatari.com/s/7_Representacion_Datos_Quimica_QGIS.rar











FloPy is the Python library that builds and executes MODFLOW models; this library has been enhanced to provide full support of MODFLOW 6 with most of its recent development is related to functionality for MODFLOW 6, tools to use vector and raster spatial data and common plotting and export functionality.