

How to do a georeferenced Stiff Diagram with Python 3 and QGIS 3 - Tutorial
/Stiff Diagrams are a common and powerful tool for the representation of surface water / groundwater main ions. Anion and cation concentrations are represented on equivalent weight (meq/l), and usually cations are represented at the left side and anions at the right side. Traditionally, this diagram is useful for the comparison of the main water chemical components by examination of a series of diagrams, however it was not easy to compare the diagrams with the position of the observacion point.
To enhance the chemical analysis on regional scale this tutorial has coupled the Stiff Diagrams with their position on a QGIS project. The diagramas are generated from a spreadsheet with Python on a Jupyter Notebook and stored a vector file (.svg), then the images files are referenced on a style file (.sld) and uploaded to QGIS3.
Read More
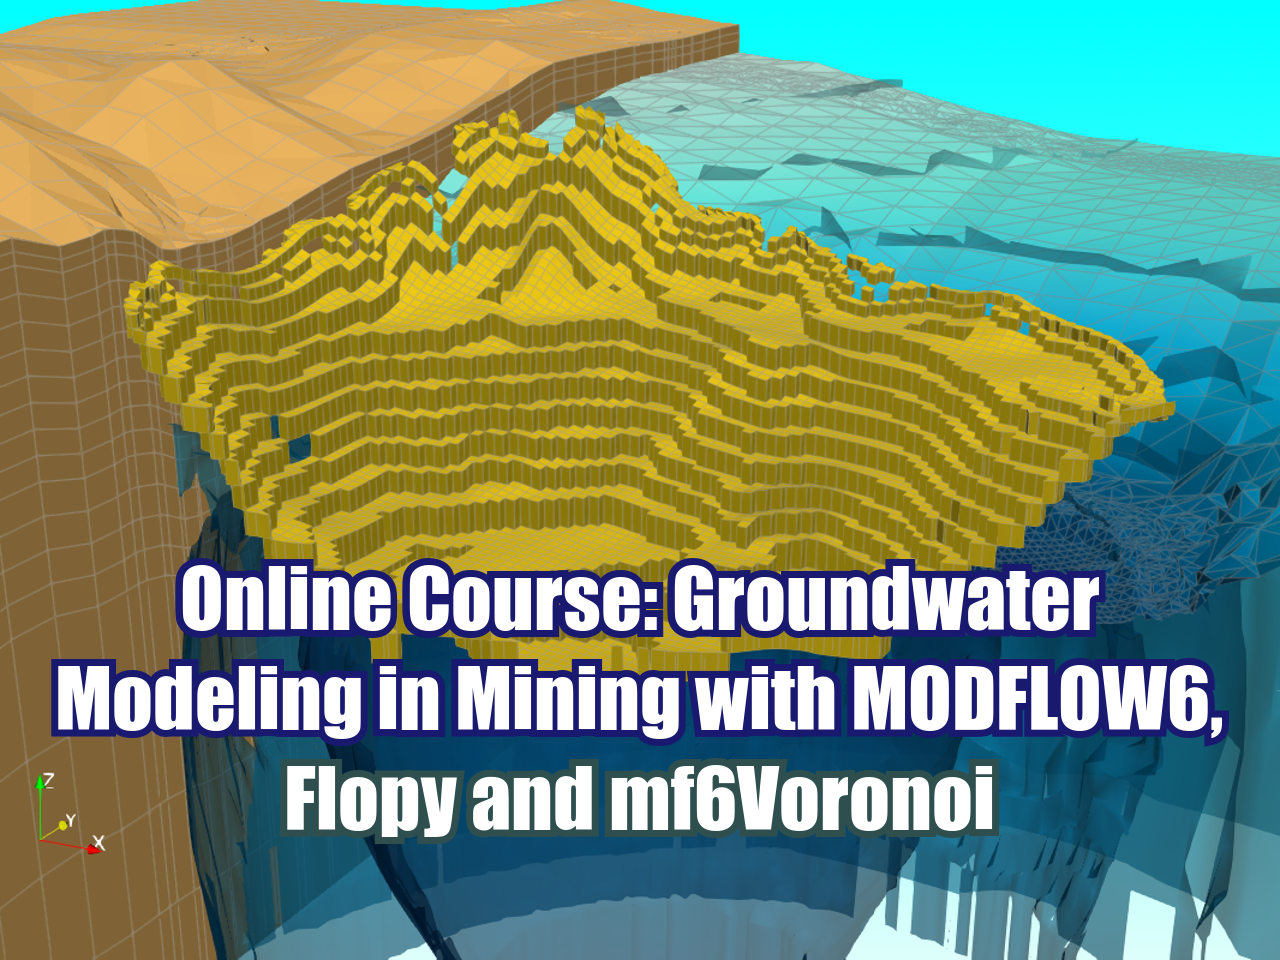











FloPy is the Python library that builds and executes MODFLOW models; this library has been enhanced to provide full support of MODFLOW 6 with most of its recent development is related to functionality for MODFLOW 6, tools to use vector and raster spatial data and common plotting and export functionality.