Watershed and Stream Network Delimitation with Python and Pysheds - Tutorial
/Never before the process of watershed delimitation became so easy. Now you can delimitate your watershed and stream network online with Hatari Utils:
Check this tutorial:
hatarilabs.com/ih-en/online-watershed-delimitation-with-hatari-utils-tutorial
What would happen if we shift our GIS geoprocessing to Python? What would happen if we treat our raster and vector spatial data as objects and variables on a Python 3 script? Then we can ask ourselves if it is neccessary to reinvent the wheel, it is necessary to change a workflow that already work on a GIS software.
There is a simple answer to this dilemma: More control
Working with Python give us more control on the geoprocessing itself since we leave the Graphical User Interface (GUI) with its icons, buttons and dialog boxes. With Python running on a Jupyter Notebook, we can link with specific files, define geoprocess and it options, make plots of draft and final data, and export results to vector/raster SIG formats. There are other advantages of spatial analysis in Python which are the reproducibility and the processing speed.
Pysheds is a Python 3 package designed for watershed delimitation and stream network extraction. This library requires a set of advanced data processing and spatial analysis libraries as Numpy, Pandas, Scipy, Scikit-Image, Rasterio and others. This tutorial show the complete procedure on a Jupyter Notebook with Python and Pysheds to :
Import a digital elevation model ( without sinks)
Determination of flow direction raster
Watershed delimitation
Analysis of flow accumulation raster
Extraction of stream network
Basin vector/raster generation
Since most users works on Windows, we have done a tutorial for the installation of Pysheds and required libraries in Windows with Anaconda.
Useful links and commands
For anaconda installation please visit:
https://www.anaconda.com/download/
Pysheds homepage:
https://github.com/mdbartos/pysheds
For the installation of the library mplleaflet, please type on Anaconda Prompt:
pip install mplleaflet
Tutorial
Rasterio, Geopandas, GDAL and Pysheds install for Anaconda in Windows
Watershed and stream network delimitation with Python and Pyshed
Python code
This is the python code used for the geoprocessing:
Import required libraries
import numpy as np
import matplotlib.pyplot as plt
import matplotlib.colors as colors
import geopandas as gpd
from pysheds.grid import Grid
import mplleaflet
%matplotlib inline
Open DEM file
grid = Grid.from_raster('../Rst/LocalDem.tif', data_name='dem')def plotFigure(data, label, cmap='Blues'):
plt.figure(figsize=(12,10))
plt.imshow(data, extent=grid.extent, cmap=cmap)
plt.colorbar(label=label)
plt.grid()plotFigure(grid.dem, 'Elevation (m)')Define direction map
#N    NE    E    SE    S    SW    W    NW
dirmap = (64,  128,  1,   2,    4,   8,    16,  32)
grid.flowdir(data='dem', out_name='dir', dirmap=dirmap)plotFigure(grid.dir,'Flow Directiom','viridis')Define catchment
# Specify pour point
x, y = 285612.017,2936416.682

# Delineate the catchment
grid.catchment(data='dir', x=x, y=y, dirmap=dirmap, out_name='catch',
               recursionlimit=15000, xytype='label', nodata_out=0)
# Clip the bounding box to the catchment
grid.clip_to('catch')# Get a view of the catchment
demView = grid.view('dem', nodata=np.nan)plotFigure(demView,'Elevation')#export selected raster
grid.to_raster(demView, '../Output/clippedElevations.tif')Define accumulation grid and stream network
grid.accumulation(data='catch', dirmap=dirmap, pad_inplace=False, out_name='acc')accView = grid.view('acc', nodata=np.nan)
plotFigure(accView,"Cell Number",'PuRd')streams = grid.extract_river_network('catch', 'acc', threshold=200, dirmap=dirmap)
streams["features"][:2]def saveDict(dic,file):
f = open(file,'w')
f.write(str(dic))
f.close()#save geojson as separate file
saveDict(streams,'../Output/streams.geojson')Plot DEM and stream network
streamNet = gpd.read_file('../Output/streams.geojson')
streamNet.crs = {'init' :'epsg:32613'}
# The polygonize argument defaults to the grid mask when no arguments are supplied
shapes = grid.polygonize()
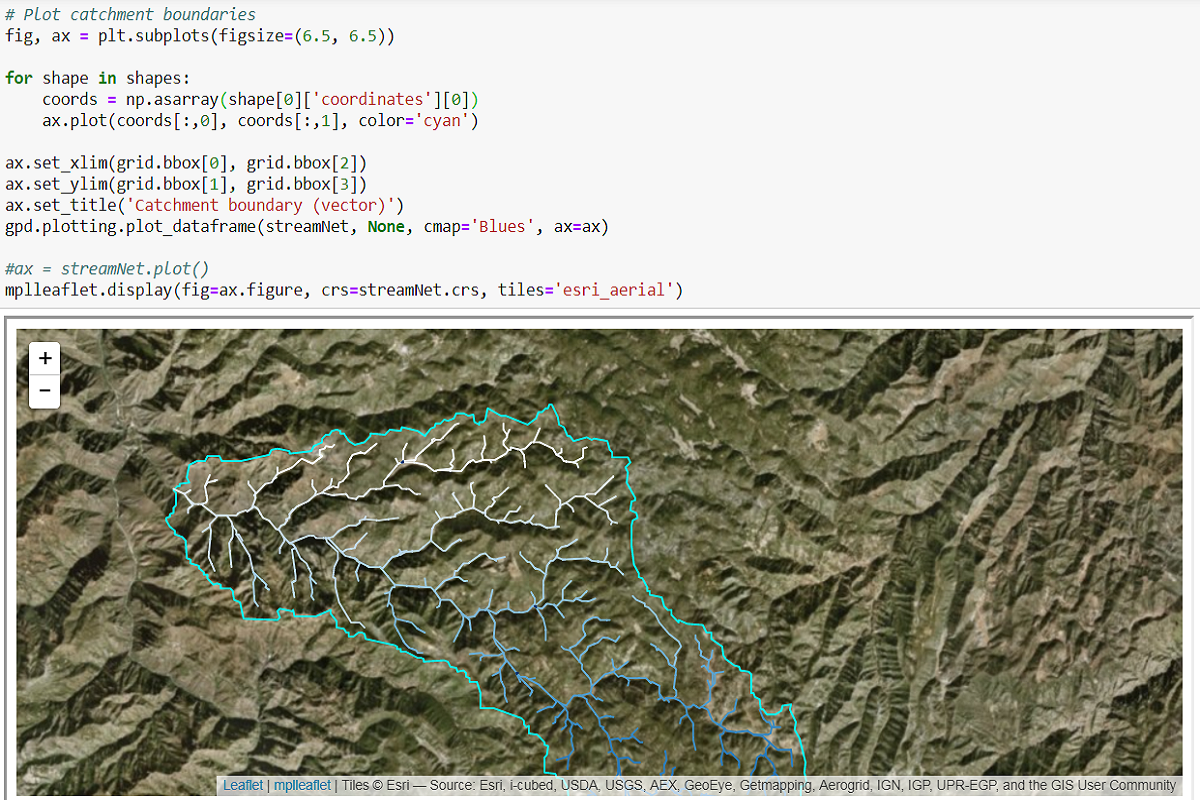
# Plot catchment boundaries
fig, ax = plt.subplots(figsize=(6.5, 6.5))
for shape in shapes:
coords = np.asarray(shape[0]['coordinates'][0])
ax.plot(coords[:,0], coords[:,1], color='cyan')
ax.set_xlim(grid.bbox[0], grid.bbox[2])
ax.set_ylim(grid.bbox[1], grid.bbox[3])
ax.set_title('Catchment boundary (vector)')
gpd.plotting.plot_dataframe(streamNet, None, cmap='Blues', ax=ax)#ax = streamNet.plot()
mplleaflet.display(fig=ax.figure, crs=streamNet.crs, tiles='esri_aerial')Input data
You can download the input data for this tutorial on this link.


