Flood simulation from direct rainfall with Python and Landlab - Tutorial
/
Simulation of direct precipitation events over a surface is important to assess the impacted areas and manage disaster situations. Response to precipitation is evaluated over cells in a 2D model and runoff is routed to the stream networks. Landlab is a Python library for a variety of surface processes and can model shallow water flow over topography with a variety of algorithms. We have developed an applied case of direct rainfall for flood modeling over a geospatial raster where an initial water height is applied and then flows over the surface. Resulting water heights are exported as geospatial rasters.
Tutorial
Code
# import generic packages
import numpy as np
from matplotlib import pyplot as plt

# import geospatial packages
import rasterio
from rasterio.plot import show
from shapely.geometry import LineString
import geopandas as gpd

# import landlab components
from landlab import RasterModelGrid, imshow_grid
from landlab.components.overland_flow import OverlandFlow
# Open raster image
rasterObj = rasterio.open('../rst/ASTGTMV003_N32W098_dem_utm_clip.tif')
show(rasterObj)
<Axes: >#extract array from raster
elevArray = rasterObj.read(1)
plt.imshow(elevArray)<matplotlib.image.AxesImage at 0x1f9ea505880>
#create grid from raster attributes
nrows = rasterObj.height  # number of raster cells on each side, initially 150
ncols = rasterObj.width
dxy = (rasterObj.transform.a,-rasterObj.transform.e)  # side length of a raster model cell, or resolution [m], initially 50

# define a landlab raster
mg = RasterModelGrid(shape=(nrows, ncols),
                     xy_spacing=dxy,
                     #xy_of_lower_left=(rasterObj.bounds[0],rasterObj.bounds[1]))
                     xy_of_lower_left=(0,0))

# show number of rows, cols and resolution
print(nrows, ncols, dxy)
830 1479 (8.350287626774987, 10.497077108433762)# create a dataset of zero values
zr = mg.add_zeros("topographic__elevation", at="node")
# apply cell elevation to defined arrray
zr += elevArray[::-1,:].ravel()
imshow_grid(mg, "topographic__elevation", shrink=0.5)
#set and apply and initial height
initialHeight = 0.1
depthArray = np.ones(elevArray.shape)*initialHeight
mg.at_node["surface_water__depth"] = depthArray
#define the flood objeds
of = OverlandFlow(mg, steep_slopes=True)
#list to store times
dtList = []#Run once and store elapsed time
of.run_one_step()
dtList.append(of.dt)
print(of.dt)5.902247591953301# explore the output data and location
# model outputs
print(of.output_var_names)
# where this nodes are locates
print(of.var_loc("surface_water__depth"))
# show the water depth array
print(mg.at_node["surface_water__depth"])('surface_water__depth', 'surface_water__discharge', 'water_surface__gradient')
node
[0.10001 0.10001 0.10001 ... 0.10001 0.10001 0.10001]# plot the resulting water depth for the first run
imshow_grid(mg, "surface_water__depth", shrink=0.5)
# run the model for 100 time steps
for i in range(100):
    of.run_one_step()
    dtList.append(of.dt)
    print("Time step: %.2f seconds. Elapsed time %.2f seconds"%(of.dt,sum(dtList)))
Time step: 1.21 seconds. Elapsed time 147.52 seconds
Time step: 1.21 seconds. Elapsed time 148.73 seconds
Time step: 1.21 seconds. Elapsed time 149.93 seconds
Time step: 1.21 seconds. Elapsed time 151.14 seconds
Time step: 1.20 seconds. Elapsed time 152.34 seconds
Time step: 1.20 seconds. Elapsed time 153.54 seconds
Time step: 1.20 seconds. Elapsed time 154.74 seconds# plot the resulting water depth for the 101th run
imshow_grid(mg, "surface_water__depth", shrink=0.5)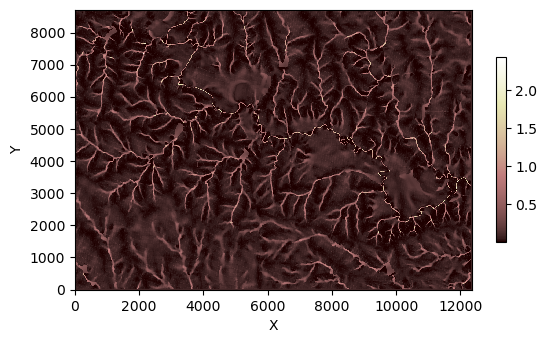
#convert the resulting data to a numpy array
zArray = mg.at_node["surface_water__depth"].reshape((nrows,ncols))[::-1,:]
#plot the array
plt.imshow(zArray)<matplotlib.image.AxesImage at 0x1f9c5579250>
# Write the array to a new GeoTIFF file
with rasterio.open(
'../Out/floodSurfaceDepth.tif',
'w',
driver='GTiff',
height=rasterObj.height,
width=rasterObj.width,
count=1, # number of bands
dtype=zArray.dtype,
crs=rasterObj.crs,
transform=rasterObj.transform
) as dst:
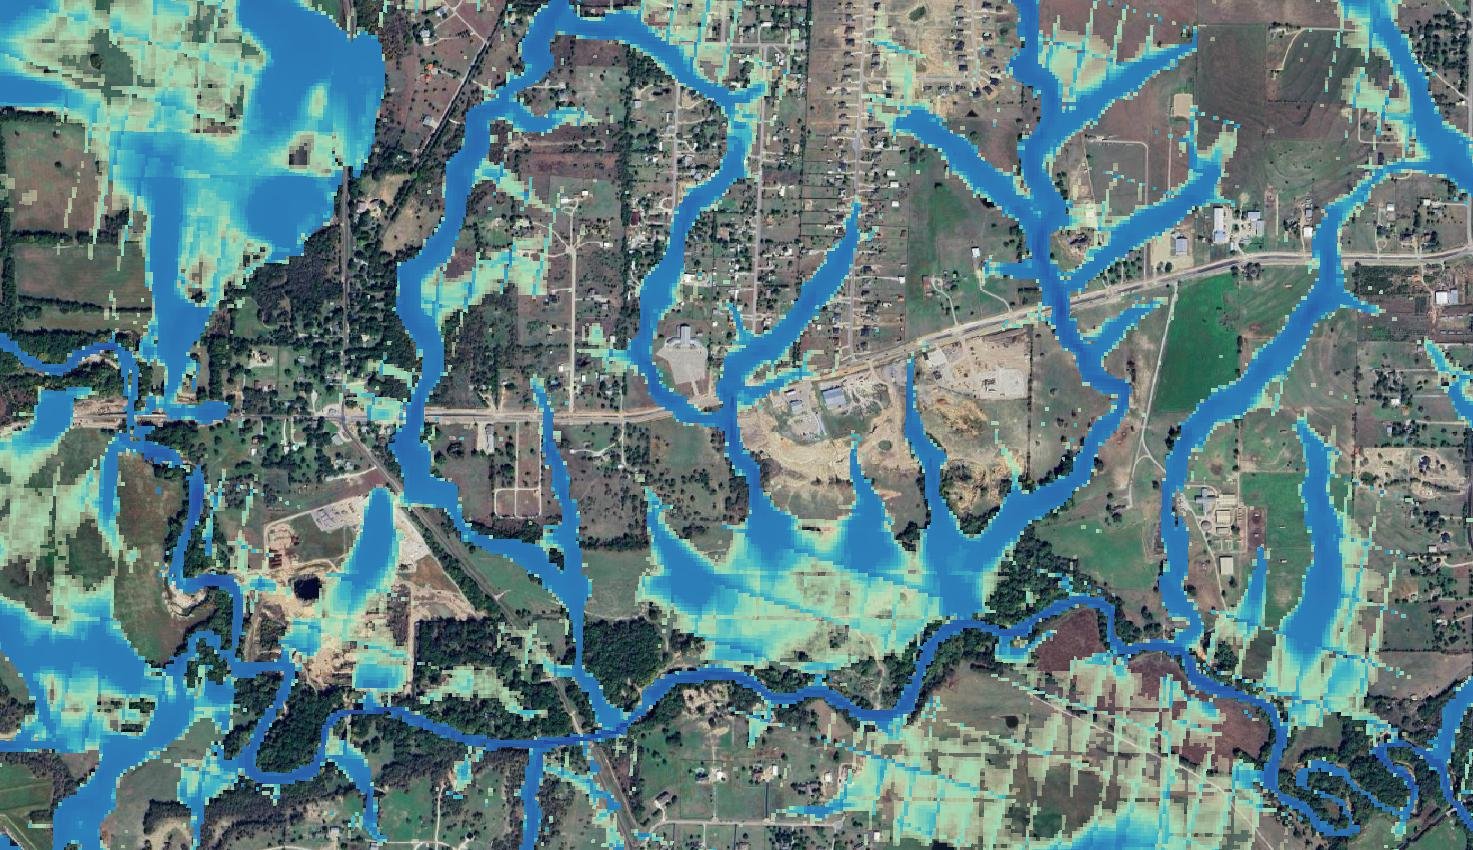
dst.write(zArray, 1) # write the data to the first band# Show the resulting raster
floodObj = rasterio.open('../Out/floodSurfaceDepth.tif')
show(floodObj)
Input data
You can download the input data from this link.