
Introduction to Online Sensor Analysis with SensorThings API and Python - Tutorial
/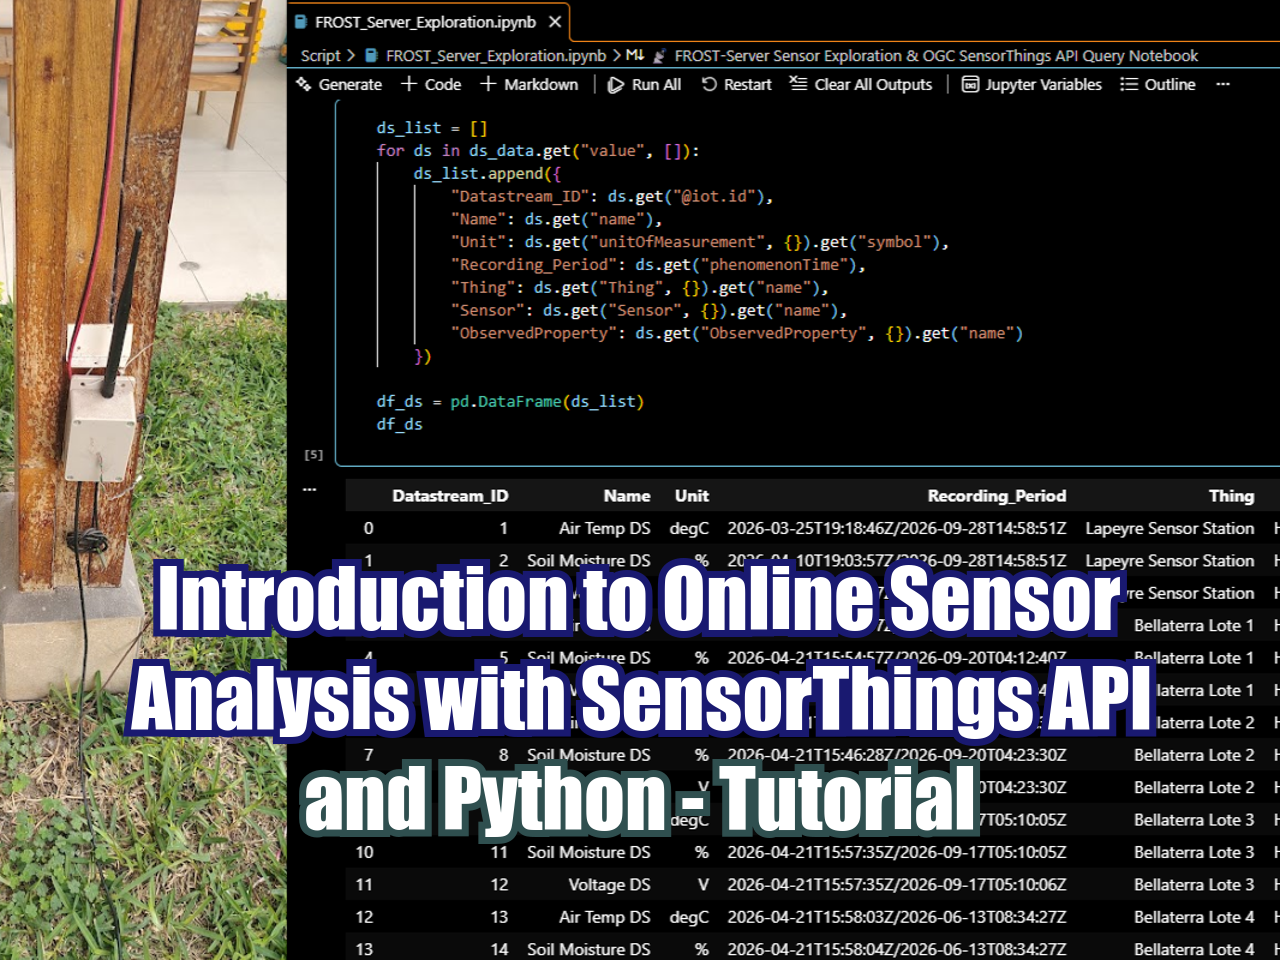
In this Hatarilabs tutorial, viewers learn how to access and query live environmental sensor data using Python and the OGC SensorThings API standard. The video walks through setting up a Jupyter Notebook environment to interact with a FROST-Server, explaining key SensorThings API concepts—including Things, Sensors, Observed Properties, and DataStreams. Using packages such as requests, pandas, and datetime, the session demonstrates how to apply API parameters like $top, $skip, $orderby, and $expand to efficiently filter and retrieve time-series observations, culminating in a data frame visualization of temperature readings from a live outdoor sensor.
Tutorial
Code
📡 FROST-Server Sensor Exploration & OGC SensorThings API Query Notebook
This notebook explores the sensors, observed parameters, recording periods, and metadata available in the FROST server using the OGC SensorThings API v1.1. It also demonstrates how to query observations using various OGC/OData API query parameters ($select, $expand, $filter, $orderby, $top, $skip, $count).
import requests
import pandas as pd
from datetime import datetime

# ── Configuration ─────────────────────────────────────────────────────────────
BASE_URL = "https://apps.hatarilabs.com/FROST-Server/v1.1"
AUTH = ("loraViewer", "frostViewer_1")

def get_frost(endpoint, params=None):
    """Helper function to issue GET requests to the FROST server."""
    url = f"{BASE_URL}/{endpoint}"
    response = requests.get(url, auth=AUTH, params=params)
    response.raise_for_status()
    return response.json()

print("✅ Setup complete. Connected to:", BASE_URL)
✅ Setup complete. Connected to: https://apps.hatarilabs.com/FROST-Server/v1.11. System-Wide Metadata Exploration
We start by listing all registered Things, Sensors, ObservedProperties, and Datastreams.
# ── 1.1 List all Things ──────────────────────────────────────────────────────
things_data = get_frost("Things")
df_things = pd.DataFrame(things_data.get("value", []))
print(f"Found {len(df_things)} Things:")
df_things[["@iot.id", "name", "description", "properties"]]
Found 8 Things:| @iot.id | name | description | properties | |
|---|---|---|---|---|
| 0 | 1 | Lapeyre Sensor Station | Sensor located on house garden | {'location': 'Lima, Peru', 'type': 'weather st... |
| 1 | 2 | Bellaterra Lote 1 | Sensor ubicado en el Lote 1 de Olivos Bellaterra | {'location': 'Caraveli, Arequipa, Peru', 'type... |
| 2 | 3 | Bellaterra Lote 2 | Sensor ubicado en el Lote 2 de Olivos Bellaterra | {'location': 'Caraveli, Arequipa, Peru', 'type... |
| 3 | 4 | Bellaterra Lote 3 | Sensor ubicado en el Lote 3 de Olivos Bellaterra | {'location': 'Caraveli, Arequipa, Peru', 'type... |
| 4 | 5 | Bellaterra Lote 4 | Sensor ubicado en el Lote 4 de Olivos Bellaterra | {'location': 'Caraveli, Arequipa, Peru', 'type... |
| 5 | 6 | Bellaterra Lote 5 | Sensor ubicado en el Lote 5 de Olivos Bellaterra | {'location': 'Caraveli, Arequipa, Peru', 'type... |
| 6 | 7 | Bellaterra Lote 6 | Sensor ubicado en el Lote 6 de Olivos Bellaterra | {'location': 'Caraveli, Arequipa, Peru', 'type... |
| 7 | 8 | Bellaterra Lote 7 | Sensor ubicado en el Lote 7 de Olivos Bellaterra | {'location': 'Caraveli, Arequipa, Peru', 'type... |
# ── 1.2 List all Sensors ─────────────────────────────────────────────────────
sensors_data = get_frost("Sensors")
df_sensors = pd.DataFrame(sensors_data.get("value", []))
print(f"Found {len(df_sensors)} Sensors:")
df_sensors[["@iot.id", "name", "description", "encodingType", "metadata"]]
Found 1 Sensors:| @iot.id | name | description | encodingType | metadata | |
|---|---|---|---|---|---|
| 0 | 1 | Hatarilabs Multi-Sensor Node | Sensor node measuring air, soil, and battery p... | http://www.opengis.net/doc/IS/SensorML/2.0 | http://example.org/sensor/metadata/node-001 |
# ── 1.3 List all Observed Properties (Parameters Available) ─────────────────
props_data = get_frost("ObservedProperties")
df_props = pd.DataFrame(props_data.get("value", []))
print(f"Found {len(df_props)} Observed Properties:")
df_props[["@iot.id", "name", "description", "definition"]]
Found 3 Observed Properties:| @iot.id | name | description | definition | |
|---|---|---|---|---|
| 0 | 1 | Air Temperature | The temperature of the air surrounding the sensor | http://vocab.nerc.ac.uk/collection/P07/current... |
| 1 | 2 | Soil Moisture | The water content held in the soil | http://vocab.nerc.ac.uk/collection/P07/current... |
| 2 | 3 | Voltage | The electrical potential difference of the sen... | http://qudt.org/vocab/quantitykind/Voltage |
# ── 1.4 List all Datastreams with Recording Periods ─────────────────────────
# Expand Thing, Sensor, and ObservedProperty in one query
ds_params = {"$expand": "Thing,Sensor,ObservedProperty"}
ds_data = get_frost("Datastreams", params=ds_params)

ds_list = []
for ds in ds_data.get("value", []):
    ds_list.append({
        "Datastream_ID": ds.get("@iot.id"),
        "Name": ds.get("name"),
        "Unit": ds.get("unitOfMeasurement", {}).get("symbol"),
        "Recording_Period": ds.get("phenomenonTime"),
        "Thing": ds.get("Thing", {}).get("name"),
        "Sensor": ds.get("Sensor", {}).get("name"),
        "ObservedProperty": ds.get("ObservedProperty", {}).get("name")
    })

df_ds = pd.DataFrame(ds_list)
df_ds| Datastream_ID | Name | Unit | Recording_Period | Thing | Sensor | ObservedProperty | |
|---|---|---|---|---|---|---|---|
| 0 | 1 | Air Temp DS | degC | 2026-03-25T19:18:46Z/2026-09-28T14:58:51Z | Lapeyre Sensor Station | Hatarilabs Multi-Sensor Node | Air Temperature |
| 1 | 2 | Soil Moisture DS | % | 2026-04-10T19:03:57Z/2026-09-28T14:58:51Z | Lapeyre Sensor Station | Hatarilabs Multi-Sensor Node | Soil Moisture |
| 2 | 3 | Voltage DS | V | 2026-03-25T19:18:47Z/2026-09-28T14:58:51Z | Lapeyre Sensor Station | Hatarilabs Multi-Sensor Node | Voltage |
| 3 | 4 | Air Temp DS | degC | 2026-04-21T15:54:57Z/2026-09-20T04:12:40Z | Bellaterra Lote 1 | Hatarilabs Multi-Sensor Node | Air Temperature |
| 4 | 5 | Soil Moisture DS | % | 2026-04-21T15:54:57Z/2026-09-20T04:12:40Z | Bellaterra Lote 1 | Hatarilabs Multi-Sensor Node | Soil Moisture |
| 5 | 6 | Voltage DS | V | 2026-04-21T15:54:57Z/2026-09-20T04:12:40Z | Bellaterra Lote 1 | Hatarilabs Multi-Sensor Node | Voltage |
| 6 | 7 | Air Temp DS | degC | 2026-04-21T15:46:28Z/2026-09-20T04:23:30Z | Bellaterra Lote 2 | Hatarilabs Multi-Sensor Node | Air Temperature |
| 7 | 8 | Soil Moisture DS | % | 2026-04-21T15:46:28Z/2026-09-20T04:23:30Z | Bellaterra Lote 2 | Hatarilabs Multi-Sensor Node | Soil Moisture |
| 8 | 9 | Voltage DS | V | 2026-04-21T15:46:28Z/2026-09-20T04:23:30Z | Bellaterra Lote 2 | Hatarilabs Multi-Sensor Node | Voltage |
| 9 | 10 | Air Temp DS | degC | 2026-04-21T15:57:34Z/2026-09-17T05:10:05Z | Bellaterra Lote 3 | Hatarilabs Multi-Sensor Node | Air Temperature |
| 10 | 11 | Soil Moisture DS | % | 2026-04-21T15:57:35Z/2026-09-17T05:10:05Z | Bellaterra Lote 3 | Hatarilabs Multi-Sensor Node | Soil Moisture |
| 11 | 12 | Voltage DS | V | 2026-04-21T15:57:35Z/2026-09-17T05:10:06Z | Bellaterra Lote 3 | Hatarilabs Multi-Sensor Node | Voltage |
| 12 | 13 | Air Temp DS | degC | 2026-04-21T15:58:03Z/2026-06-13T08:34:27Z | Bellaterra Lote 4 | Hatarilabs Multi-Sensor Node | Air Temperature |
| 13 | 14 | Soil Moisture DS | % | 2026-04-21T15:58:04Z/2026-06-13T08:34:27Z | Bellaterra Lote 4 | Hatarilabs Multi-Sensor Node | Soil Moisture |
| 14 | 15 | Voltage DS | V | 2026-04-21T15:58:04Z/2026-06-13T08:34:28Z | Bellaterra Lote 4 | Hatarilabs Multi-Sensor Node | Voltage |
| 15 | 16 | Air Temp DS | degC | None | Bellaterra Lote 5 | Hatarilabs Multi-Sensor Node | Air Temperature |
| 16 | 17 | Soil Moisture DS | % | None | Bellaterra Lote 5 | Hatarilabs Multi-Sensor Node | Soil Moisture |
| 17 | 18 | Voltage DS | V | None | Bellaterra Lote 5 | Hatarilabs Multi-Sensor Node | Voltage |
| 18 | 19 | Air Temp DS | degC | None | Bellaterra Lote 6 | Hatarilabs Multi-Sensor Node | Air Temperature |
| 19 | 20 | Soil Moisture DS | % | None | Bellaterra Lote 6 | Hatarilabs Multi-Sensor Node | Soil Moisture |
| 20 | 21 | Voltage DS | V | None | Bellaterra Lote 6 | Hatarilabs Multi-Sensor Node | Voltage |
| 21 | 22 | Air Temp DS | degC | None | Bellaterra Lote 7 | Hatarilabs Multi-Sensor Node | Air Temperature |
| 22 | 23 | Soil Moisture DS | % | None | Bellaterra Lote 7 | Hatarilabs Multi-Sensor Node | Soil Moisture |
| 23 | 24 | Voltage DS | V | None | Bellaterra Lote 7 | Hatarilabs Multi-Sensor Node | Voltage |
2. Selected Datastream Analysis & Recording Period Inspection
Here we target a specific datastream to inspect its recording timeframe and sample values[cite: 1, 2].
DATASTREAM_ID = 1  # Change this to any active Datastream ID (e.g., 4 or 22)[cite: 1, 2]

ds_detail = get_frost(f"Datastreams({DATASTREAM_ID})")
print(f"📊 Datastream #{DATASTREAM_ID}: {ds_detail.get('name')}")
print(f"Description: {ds_detail.get('description')}")
print(f"Unit: {ds_detail.get('unitOfMeasurement')}")
print(f"Phenomenon Time (Recording Period): {ds_detail.get('phenomenonTime')}")
print(f"Result Time Range: {ds_detail.get('resultTime')}")
📊 Datastream #1: Air Temp DS
Description: Datastream for Air Temperature
Unit: {'definition': 'http://example.org/unit', 'name': '°C', 'symbol': 'degC'}
Phenomenon Time (Recording Period): 2026-03-25T19:18:46Z/2026-09-28T14:58:51Z
Result Time Range: None3. Exploring OGC SensorThings API Query Options
The SensorThings API (OData standard) supports parameters to filter, paginate, sort, expand, and format data[cite: 1, 2].
3.1 $count: Get Total Number of Observations
res = get_frost(f"Datastreams({DATASTREAM_ID})/Observations", params={"$count": "true", "$top": 1})
print(f"Total observations in Datastream {DATASTREAM_ID}:", res.get("@iot.count"))
Total observations in Datastream 1: 155213.2 $top & $skip: Pagination
Retrieve data in chunks using page size ($top) and offset ($skip).
# Fetch 5 observations starting from offset 0
page1 = get_frost(f"Datastreams({DATASTREAM_ID})/Observations", params={"$top": 5, "$skip": 0})
pd.DataFrame(page1.get("value", []))[["@iot.id", "result", "phenomenonTime"]]| @iot.id | result | phenomenonTime | |
|---|---|---|---|
| 0 | 266 | 26.7 | 2026-03-25T19:18:46Z |
| 1 | 269 | 28.0 | 2026-03-25T19:34:42Z |
| 2 | 272 | 27.6 | 2026-03-25T19:50:39Z |
| 3 | 275 | 27.4 | 2026-03-25T20:06:36Z |
| 4 | 278 | 27.1 | 2026-03-25T20:22:32Z |
3.3 $orderby: Sorting Records
Sort observations chronologically ascending or descending.
# Fetch the 5 most recent observations
latest = get_frost(f"Datastreams({DATASTREAM_ID})/Observations", params={
    "$orderby": "phenomenonTime desc",
    "$top": 5
})
pd.DataFrame(latest.get("value", []))[["@iot.id", "result", "phenomenonTime"]]| @iot.id | result | phenomenonTime | |
|---|---|---|---|
| 0 | 101770 | 28.1 | 2026-09-28T14:58:51Z |
| 1 | 101767 | 26.9 | 2026-09-28T14:42:55Z |
| 2 | 101764 | 25.7 | 2026-09-28T14:27:00Z |
| 3 | 101761 | 25.3 | 2026-09-28T14:11:06Z |
| 4 | 101758 | 24.6 | 2026-09-28T13:55:12Z |
3.4 $select: Choose Specific Attributes
Reduce bandwidth by retrieving only required fields (e.g., result, phenomenonTime).
selected = get_frost(f"Datastreams({DATASTREAM_ID})/Observations", params={
    "$select": "result,phenomenonTime",
    "$top": 3
})
pd.DataFrame(selected.get("value", []))| result | phenomenonTime | |
|---|---|---|
| 0 | 26.7 | 2026-03-25T19:18:46Z |
| 1 | 28.0 | 2026-03-25T19:34:42Z |
| 2 | 27.6 | 2026-03-25T19:50:39Z |
3.5 $filter: Conditional Queries
Filter by date ranges (phenomenonTime) or numerical thresholds on result.
# # Filter observations where result is greater than 20.0
# filtered_val = get_frost(f"Datastreams({DATASTREAM_ID})/Observations", params={
#     "$filter": "result add 0 gt 20",
#     "$orderby": "phenomenonTime desc",
#     "$top": 25
# })
# pd.DataFrame(filtered_val.get("value", []))
3.6 $expand: Multi-Entity Inline Navigation
Fetch observations along with their parent Datastream and associated Sensor/ObservedProperty metadata in a single request.
expanded = get_frost(f"Datastreams({DATASTREAM_ID})/Observations", params={
    "$expand": "Datastream($select=name,unitOfMeasurement),FeatureOfInterest",
    "$top": 2
})
expanded.get("value", [])
[{'@iot.selfLink': 'https://apps.hatarilabs.com/FROST-Server/v1.1/Observations(266)',
'@iot.id': 266,
'phenomenonTime': '2026-03-25T19:18:46Z',
'resultTime': None,
'result': '26.7',
'Datastream': {'name': 'Air Temp DS',
'unitOfMeasurement': {'definition': 'http://example.org/unit',
'name': '°C',
'symbol': 'degC'}},
'FeatureOfInterest': {'@iot.selfLink': 'https://apps.hatarilabs.com/FROST-Server/v1.1/FeaturesOfInterest(1)',
'@iot.id': 1,
'name': 'Lapeyre House',
'description': 'House with a sensor for soil moisture and temperature',
'encodingType': 'application/geo+json',
'feature': {'type': 'Point', 'coordinates': [-76.99156425, -12.1313891]}},
'Datastream@iot.navigationLink': 'https://apps.hatarilabs.com/FROST-Server/v1.1/Observations(266)/Datastream',
'FeatureOfInterest@iot.navigationLink': 'https://apps.hatarilabs.com/FROST-Server/v1.1/Observations(266)/FeatureOfInterest'},
{'@iot.selfLink': 'https://apps.hatarilabs.com/FROST-Server/v1.1/Observations(269)',
'@iot.id': 269,
'phenomenonTime': '2026-03-25T19:34:42Z',
'resultTime': None,
'result': '28.0',
'Datastream': {'name': 'Air Temp DS',
'unitOfMeasurement': {'definition': 'http://example.org/unit',
'name': '°C',
'symbol': 'degC'}},
'FeatureOfInterest': {'@iot.selfLink': 'https://apps.hatarilabs.com/FROST-Server/v1.1/FeaturesOfInterest(1)',
'@iot.id': 1,
'name': 'Lapeyre House',
'description': 'House with a sensor for soil moisture and temperature',
'encodingType': 'application/geo+json',
'feature': {'type': 'Point', 'coordinates': [-76.99156425, -12.1313891]}},
'Datastream@iot.navigationLink': 'https://apps.hatarilabs.com/FROST-Server/v1.1/Observations(269)/Datastream',
'FeatureOfInterest@iot.navigationLink': 'https://apps.hatarilabs.com/FROST-Server/v1.1/Observations(269)/FeatureOfInterest'}]4. Converting Query Results into a Time Series DataFrame
Combine $select, $orderby, and $top to pull observations into a Pandas DataFrame formatted for data analysis and plotting.
ts_data = get_frost(f"Datastreams({DATASTREAM_ID})/Observations", params={
    "$select": "result,phenomenonTime",
    "$orderby": "phenomenonTime asc",
    "$top": 100
})

df_ts = pd.DataFrame(ts_data.get("value", []))
if not df_ts.empty:
    df_ts["phenomenonTime"] = pd.to_datetime(df_ts["phenomenonTime"])
    df_ts["result"] = pd.to_numeric(df_ts["result"])
    df_ts.set_index("phenomenonTime", inplace=True)
    print(f"Loaded {len(df_ts)} points into DataFrame:")
    print(df_ts.head())
else:
    print("No observations found for this datastream.")
Loaded 100 points into DataFrame:
result
phenomenonTime
2026-03-25 19:18:46+00:00 26.7
2026-03-25 19:34:42+00:00 28.0
2026-03-25 19:50:39+00:00 27.6
2026-03-25 20:06:36+00:00 27.4
2026-03-25 20:22:32+00:00 27.1#quick plot of the results
df_ts.plot()<Axes: xlabel='phenomenonTime'>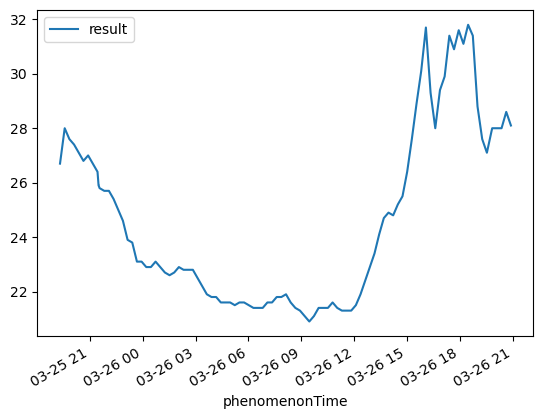
Input data
You can download the input data from this link.