

Maps of Days without Rain generation with Python and Rasterio - Tutorial
/
Water resurces management requires not only some direct values as precipitation amounts but also more elaborated data as days without rain. Based on the CHIRPS dataset for year 2022 stored on NetCDF format we have elaborated a map of days without rain for a given country and exported the results as a fully geospatial raster. There is a particular discussion about the data type and the data value to calculate and store value just for the selected location.
Content
Open and explore the CHIRPS dataset
Clip the dataset for a selected country and time
Generate an array of days without rain
Export days without rain geospatial raster
Interactive visualization of a geospatial raster in Jupyter
Tutorial
Code
#from osgeo import gdal
import rasterio.mask as mask
from rasterio.plot import show
import matplotlib.pyplot as plt
import geopandas as gpd
import numpy as np
import rasterio
import folium
ds = rasterio.open('Data/chirps-v2.0.2022.days_p25.nc')ds.boundsBoundingBox(left=-180.0, bottom=-50.0, right=180.0, top=50.0)ds.count365ds.crsds.xy(10,10)(-177.375, 47.375)show(ds.read(1))
<Axes: >show(ds)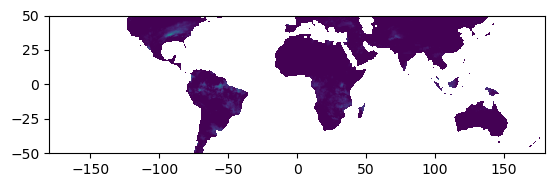
<Axes: >worldBorders = gpd.read_file('Data/Shp/World_Countries.shp')
worldBorders.crs<Geographic 2D CRS: EPSG:4326>
Name: WGS 84
Axis Info [ellipsoidal]:
- Lat[north]: Geodetic latitude (degree)
- Lon[east]: Geodetic longitude (degree)
Area of Use:
- name: World.
- bounds: (-180.0, -90.0, 180.0, 90.0)
Datum: World Geodetic System 1984 ensemble
- Ellipsoid: WGS 84
- Prime Meridian: GreenwichworldBorders.plot()<Axes: >
colRow = worldBorders[worldBorders['COUNTRY']=='Colombia']
colRow = colRow.reset_index()
colRow| index | COUNTRY | geometry | |
|---|---|---|---|
| 0 | 47 | Colombia | MULTIPOLYGON (((-81.71306 12.49028, -81.72014 ... |
colBorder = colRow.iloc[0].geometry
colBordertype(colBorder)shapely.geometry.multipolygon.MultiPolygonoutImage, outTransform = mask.mask(ds, [colBorder],crop=True)outImage.shape(365, 68, 60)show(outImage[10], vmin=0, vmax=outImage.max())
<Axes: >outEmpty = np.copy(outImage[0])
outEmpty[outEmpty != -9999] = np.nan
outEmpty[outEmpty == -9999] = 1
plt.imshow(outEmpty)<matplotlib.image.AxesImage at 0x2afdf643890>
outImage[outImage==-9999] = np.nanoutImage.shape
#definition of(365, 68, 60)#precipitation representation for a single day fig, ax = plt.subplots(figsize=(12,12)) im = ax.imshow(outImage[10], vmin=0, vmax=outImage.max(), aspect='equal', cmap='cool') plt.colorbar(im, shrink=0.4) plt.show()
#definition of day without rain raster as a nan raster
daysNoRain = np.zeros(outImage.shape[1:])*np.nan
daysNoRain
array([[nan, nan, nan, ..., nan, nan, nan],
[nan, nan, nan, ..., nan, nan, nan],
[nan, nan, nan, ..., nan, nan, nan],
...,
[nan, nan, nan, ..., nan, nan, nan],
[nan, nan, nan, ..., nan, nan, nan],
[nan, nan, nan, ..., nan, nan, nan]])nrows = daysNoRain.shape[0]
ncols = daysNoRain.shape[1]
for row in range(nrows):
for col in range(ncols):
cellSeries = outImage[:,row,col]
if cellSeries.sum()>=0:
daysRain = cellSeries[cellSeries>0].shape[0]
daysNoRain[row,col] = outImage.shape[0] - daysRain#show preview of days without rain
plt.imshow(daysNoRain)
plt.colorbar()
plt.show()
#generation of a geospatial rasteroutTransformAffine(0.25, 0.0, -81.75,
0.0, -0.25, 12.75)daysNoRain.dtypedtype('float64')daysNoRain.shape(68, 60)outRaster = rasterio.open('Data/daysNoRain.tif',
'w',
driver='Gtiff',
width = daysNoRain.shape[1],
height = daysNoRain.shape[0],
count=1,
dtype = daysNoRain.dtype,
crs = rasterio.CRS.from_epsg(4326),
transform=outTransform)
outRaster.write(daysNoRain, indexes=1)
outRaster.close()# representation of the generated raster
daysRaster = rasterio.open('Data/daysNoRain.tif')
daysArray = daysRaster.read(1)
boundList = [x for x in daysRaster.bounds]
boundList[-81.75, -4.25, -66.75, 12.75]#get rid of the nan for color interpretation
daysArray = np.nan_to_num(daysArray)plt.imshow(daysArray)<matplotlib.image.AxesImage at 0x2afe3c06d10>
rasLon = (boundList[3] + boundList[1])/2
rasLat = (boundList[2] + boundList[0])/2
mapCenter = [rasLon, rasLat]
# Create a Folium map centered at a specific location
m = folium.Map(location=mapCenter, zoom_start=5)
# Add raster overlay
image = folium.raster_layers.ImageOverlay(
image=daysArray,
bounds=[[boundList[1], boundList[0]], [boundList[3], boundList[2]]],
opacity=0.6,
interactive=True,
cross_origin=False,
)
image.add_to(m)
# Add layer control
folium.LayerControl().add_to(m)
# Display the map
mInput data
You can download the input data from this link.
owncloud.hatarilabs.com/s/X7GlDFLst9fjDQj
Password to download data: Hatarilabs


