Tutorial: Area of Study AsterDEM Download and Basin - Stream Delineation in QGIS

QGIS is a open source software for spatial analysis and data representation. There are many tools from QGIS for the hydrological/hydrogeological evaluation and modeling. This time we have made a tutorial with the whole procedure of the download process for a AsterDEM only on the extension of an area of study. The DEM was later reprojected on QGIS and processed to get the channel network and drainage basins. The tutorial has the purpose to show how simple is the process of working with QGIS and Processing.

Read More


Suscribe to our online newsletter

Subscribe for free newsletter, receive news, interesting facts and dates of our courses in water resources.


How to insert a Geological Fracture on a Hydrogeological Model with MODFLOW and Model Muse

Model Muse is a software for the pre and post data processing of hydrogeological 3D model in MODFLOW. Both Model Muse and MODFLOW are developed by the USGS (usgs.gov). Model Muse is designed to work with objects and datasets, a powerful model construction methodology that allows the quick setup of boundary conditions, a simple way of progressive refinement and interesting features as inserting geological fractures on the numerical model.

This tutorial show the whole procedure for the conceptualization of several fractures based on some known fracture information as a point on the fractures, the azimuth and elevation. The tutorial deals with the theorethical determination of the fracture plane equation, the construction of a dataset with the desired equation plus the implementation of object that represents the fracture with the relevant hydrogeological features.

Read More


Suscribe to our online newsletter

Subscribe for free newsletter, receive news, interesting facts and dates of our courses in water resources.


Tutorial Infiltration Gallery for Water Supply Modeling with MODFLOW and Model Muse

Tutorial for the simulation of filtration galleries close to a river. Modeling done with MODFLOW, Model Muse and QGIS.

Read More


Suscribe to our online newsletter

Subscribe for free newsletter, receive news, interesting facts and dates of our courses in water resources.


Tutorial of a Cross Seccion of Water Quality with MODFLOW, MT3DMS y QGIS

Groundwater flow modeling depends on GIS data, and its output is compatible with a sort of GIS tools. In order to do analysis or representation from contaminant transport modeling it is needed a sort of commands, formats, tools and plugins from a stack of programs as ModelMuse and QGIS.

This tutorial is not only a example of water quality representation, it is as well a discussión on the main parts of modeling construction and simulation.

Read More


Suscribe to our online newsletter

Subscribe for free newsletter, receive news, interesting facts and dates of our courses in water resources.


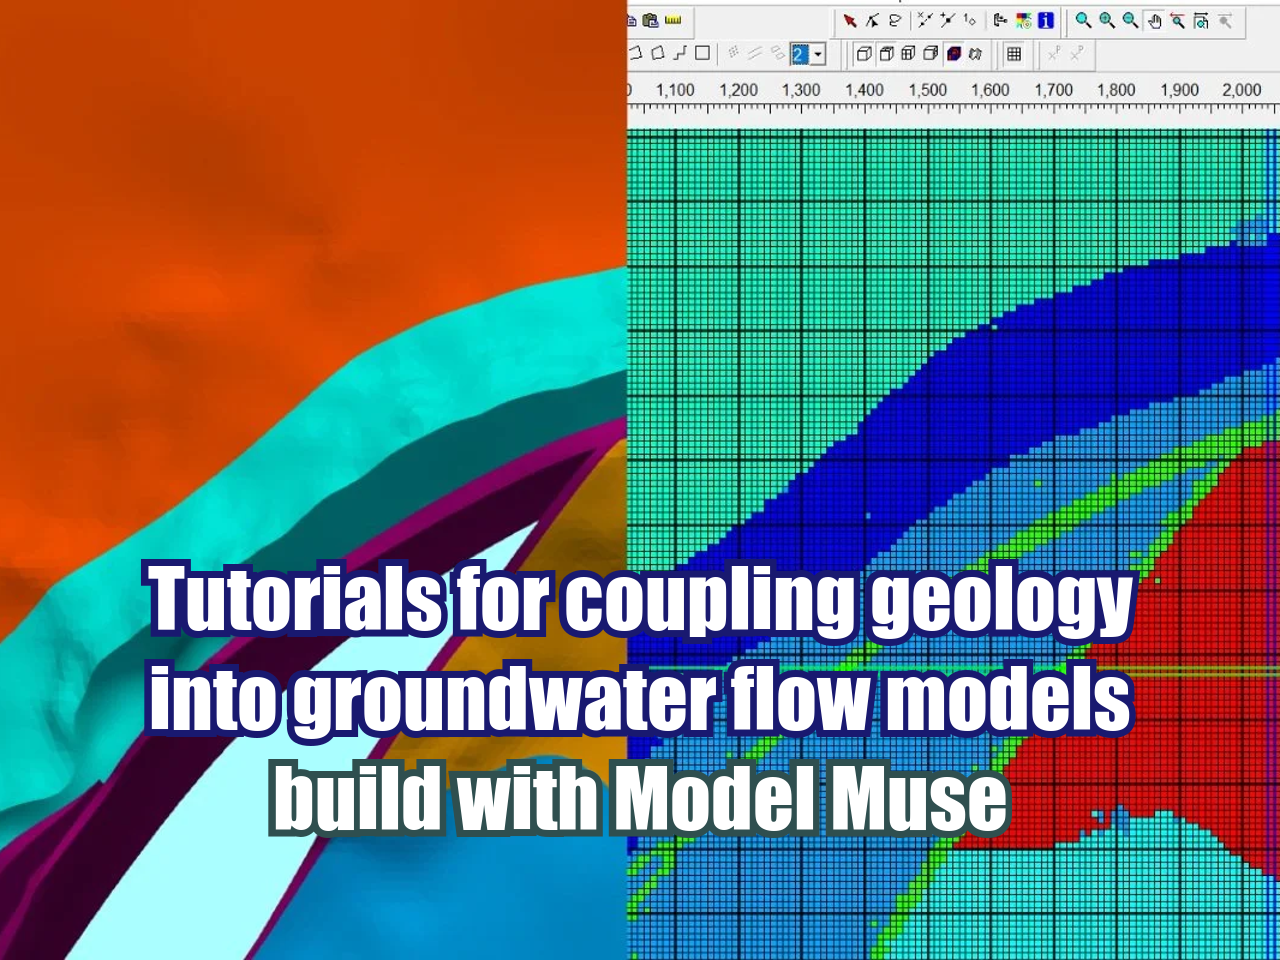
How to insert a Geological Contact in MODFLOW with MODEL MUSE

Model Muse and QGIS makes possible to deal with geological data for the groundwater flow model cocntstruction. A diverse group of tools are required to process and insert geological features as contacts or faults. This tutorial show the whole procedure from the ground up to build the model geometry and insert a geological contact as the interfase within two layers.

Read More


Suscribe to our online newsletter

Subscribe for free newsletter, receive news, interesting facts and dates of our courses in water resources.


Tutorial to Georeference Google Searches with Python and QGIS

To carry out a series of studies and investigations we have to know both name and location of certain places. This may be available through some web pages, however the use of data is limited and advance geoprocessing tools on softwares as QGIS can not be used. There are several services or APIs that can bring you the spatial location of Google searches. In this tutorial we will use the Google Maps API for the location of Hospitals in a radius of 5 kilometers from a point in Miraflores, Lima. Only open source software tools have been used for this tutorial.

Read More


Suscribe to our online newsletter

Subscribe for free newsletter, receive news, interesting facts and dates of our courses in water resources.


Recharge Estimation by Daily Precipitation with MODFLOW UZF and Python

The processes of the superficial and groundwater water cycle are related to the precipitation (shape and intensity) and the dynamic of soil moisture. This dynamic of soil moisture is determined by the type of soil and the root zone in a daily, or even hourly, temporal scale. These phenomena have not been considered or studied in conventional hydrogeology text books, maybe because of their intensive use of modeling tools and complex conceptualizations and validations.

Read More


Suscribe to our online newsletter

Subscribe for free newsletter, receive news, interesting facts and dates of our courses in water resources.


Modeling of Soil Erosion with Landlab in Python – Open Source Software

Soil erosion is the movement of the upper soil layers caused by processes related to water or wind. Soil erosion can occur slowly on the surface, however, soil alterations caused by human activity can increase this rate in 10 to 40 times. The evaluation of soil erosion is important to estimate the impact of human activities and the planning of remediation plans.

This article introduces the Landlab environment, which is developed in Python, as well as a practical example of soil erosion modeling on slopes over time.

Read More


Suscribe to our online newsletter

Subscribe for free newsletter, receive news, interesting facts and dates of our courses in water resources.


Determination of Mining Projects Areas with Satellite Imagery and QGIS

Our current working conditions require access to spatial information in short periods of time. Work planning tasks or quoting of services require data of distances, areas, proximities, medium elevations, among others. The data can be given by clients, organizations or by field monitoring, but they may not be available at the required moment. The use of geoprocessng tools of satellite imagery reduces the required time to have this information. Since QGIS is open source and the Landsat, MODIS and Aster images are free, this type of geoprocessing is versatile, economic and friendly for any user with basic/intermediate QGIS knowledge.

Read More


Suscribe to our online newsletter

Subscribe for free newsletter, receive news, interesting facts and dates of our courses in water resources.


Tutorial: How to convert MODFLOW-2005 files to MODFLOW-6 format

The United States Geological Survey (USGS) has just released a new MODFLOW version: MODFLOW-6. This one comes with new functionalities to make it easier to create input files and perform simulations. Among the downloaded MODFLOW-6 files, there is an executable file to convert MODFLOW-2005 files to the new MODFLOW-6 format. In this tutorial we will show you how to do this.

Read More


Suscribe to our online newsletter

Subscribe for free newsletter, receive news, interesting facts and dates of our courses in water resources.


How to generate a legend on map canvas in QGIS with PyQGIS - Tutorial

QGIS is a powerful and user friendly GIS software. The user can represent points and style them according to the measured values. This tutorial deals with the legend representation on map canvas for a better geospatial data analysis. 
Legend representation is done with just 6 lines of code on PyQGIS, the Python tool of QGIS.

Read More


Suscribe to our online newsletter

Subscribe for free newsletter, receive news, interesting facts and dates of our courses in water resources.


Tutorial to Generate Orthophotos from Drone Images with WebODM

Drone imagery is a powerful for geospatial analysis on small scales and high resolutions. The availability to take drone images and the open source tools available allow the user to generate orthophotos with resolutions of less than 1 meter and fully compatible with SIG softwares as QGIS.

This tutorial show the procedure to make an orthophoto with WebODM based on drone images from a pinneapple field.

Read More


Suscribe to our online newsletter

Subscribe for free newsletter, receive news, interesting facts and dates of our courses in water resources.


How to install Web OpenDroneMap (WebODM) in Windows with Docker

WebOpenDroneMap is a friendly Graphical User Interfase (GUI) of OpenDroneMap. It enhances the capabilities of OpenDroneMap by providing a easy tool for processing drone imagery with bottoms, process status bars, and a new way to store images. WebODM allows to work by projects, so the user can create different projects and process the related images.

As a whole, WebODM in Windows is a implementation of PostgresSQL, Node, Django and OpenDroneMap and Docker. The software instalation requires 6gb of disk space plus Docker. It seem huge but it is the only way to process drone imagery in Windows using just open source software. We definitely see a huge potential of WebODM for the image processing, therefore we have done this tutorial for the installation and we will post more tutorial for the application of WebODM with drone images.

Read More


Suscribe to our online newsletter

Subscribe for free newsletter, receive news, interesting facts and dates of our courses in water resources.


VIDEO: Webminar on Satellite Imagery Analysis with QGIS - May 10, 2017

Satellite Imagery has developed a new dimension in the evaluation of water resources, environment, land planning, atmosphere and climate change. There are many satellites and imagery available, many of them being free of cost. At the same time, powerful open source tools for spatial analysis and representation are available.

This webminar wants to give a perspective on search, manage and interpretation of satellite imagery, through practical exercises using QGIS.

Read More


Suscribe to our online newsletter

Subscribe for free newsletter, receive news, interesting facts and dates of our courses in water resources.


Parameter Optimization Simulation for a Basin Model with HEC HMS

Model optimization involves adjusting parameter values so that the simulated results match stream flows as closely as posible. The software have two different search algorithms for the optimization as well as a variety of objective functions to measure the goodness of fit between simulated and observed stream flow.

Optimization trials are quite simple to set up and compute. This tutorial show the complete procedure to run a optimization for a hydrological model on a andean basin.

Read More


Suscribe to our online newsletter

Subscribe for free newsletter, receive news, interesting facts and dates of our courses in water resources.


How to create contours from a Raster File - Example on a NDVI Layer

This tutorial show the procedure to create contours from a raster file considering interval definition. The example is made from a NDVI raster file.

Read More


Suscribe to our online newsletter

Subscribe for free newsletter, receive news, interesting facts and dates of our courses in water resources.


How to cut a Raster File on QGIS - Example on a NDVI Layer

This tutorial show the procedure to cut a NDVI Raster File calculated from a Sentinel 2 Granule on QGIS.

Read More


Suscribe to our online newsletter

Subscribe for free newsletter, receive news, interesting facts and dates of our courses in water resources.


How to calculate the NDVI Index from a Sentinel 2 Image

This tutorial show the prodecure to calculate the NDVI from Sentinel 2 bands on QGIS.

Read More


Suscribe to our online newsletter

Subscribe for free newsletter, receive news, interesting facts and dates of our courses in water resources.


How to represent Sentinel 2 Bands in a False Color Image with QGIS

False color images are used to enhance certain cover types as vegetation on the image representation. This tutorial show the procedure represent the bands of a False Color image from Sentinel 2 bands in QGIS. 

Read More


Suscribe to our online newsletter

Subscribe for free newsletter, receive news, interesting facts and dates of our courses in water resources.


How to represent Sentinel 2 Bands in a True Color Image with QGIS

This tutorial show the procedure represent the bands of a Sentinel 2 Granule (Image) in QGIS. The representation of the image is True Color (Red, Green and Blue)

Read More


Suscribe to our online newsletter

Subscribe for free newsletter, receive news, interesting facts and dates of our courses in water resources.