Convert geological units from Leapfrog (*.msh) to VTK using Python and GemGIS - Tutorial

This tutorial shows the complete procedure to convert a geological unit as a Leapfrog mesh (*.msh) to the VTK (Visualization Toolkit) format using Python and GemGIS. Follow these steps to seamlessly transfer your geological data for advanced visualization, analysis and comparison with other model results.

Read More
1 Comment


Suscribe to our online newsletter

Subscribe for free newsletter, receive news, interesting facts and dates of our courses in water resources.


Geological modeling of sedimentary layers from geospatial rasters with Python and Gempy - Tutorial

Based on a coupled workflow on QGIS and Python it is possible to extract the required information for a Gempy model and run it for defined voxel sizes. This tutorial covers the whole procedure of spatial data preparation, data preprocessing in defined formats and geological modeling with Python and Gempy.

Read More
Comment


Suscribe to our online newsletter

Subscribe for free newsletter, receive news, interesting facts and dates of our courses in water resources.


How to georeference a image/raster with Python and Rasterio - Tutorial

Georeferencing in Python has the advantage that it can be performed repeatedly without the need to define control points each time. It also allows you to add/remove control points and observe the impact on the transformation array. This tutorial demonstrates the complete georeferencing process of a national map using 3 points whose pixel coordinates have been extracted from the Paint utility in Windows. The tutorial also exports the raster while assigning a reference system.

Read More
2 Comments


Suscribe to our online newsletter

Subscribe for free newsletter, receive news, interesting facts and dates of our courses in water resources.


Groundwater modeling of a pumping test over a confined aquifer with MODFLOW-6 and FloPy - Tutorial

We have done an applied groundwater model for a pumping test on a confined aquifer. The wellsite is located on the Clairborne aquifer (Georgia, USA) and has two observations on different layers besides the well itself. The aquifer test has two periods of pumping and recovery that last 3 days each one and the numerical model was constructed with MODFLOW-6 based on a Python script with the FloPy package. Comparison among observed and simulated wells were done with plots in Matplotlib.

Read More
Comment


Suscribe to our online newsletter

Subscribe for free newsletter, receive news, interesting facts and dates of our courses in water resources.


Theis solution for pumping test interpretation in confined aquifers in Aquifer App - Tutorial

Theis (1935) developed a method to estimate values of T and S from pumping test data. Time and drawdown data are measured in an observation well and then matched to the Theis curve. Aquifer App, a web framework for applications in hydrogeology now has a tool for the interpretation of the Hydraulic Transmissivity based on the Theis solution. This is a perfect tool to parametrize homogeneous and confined aquifers on transient state flow conditions.

Read More
2 Comments


Suscribe to our online newsletter

Subscribe for free newsletter, receive news, interesting facts and dates of our courses in water resources.


Export MODFLOW6 3D model geometry (as Vtk) with Python - Tutorial

Generating 3D visualizations of groundwater models is essential to analyze the flow regime, perform quality checks and see the interaction of the groundwater body with external factors / boundary conditions. The Flopy library has tools to export the parameters, boundary conditions and results that we have modified and compiled within a Python class. The use of this class allows the generation of Vtk files on a friendly way and in few steps. The tutorial also includes a representation of the parameters generated in ParaView.

Read More
Comment


Suscribe to our online newsletter

Subscribe for free newsletter, receive news, interesting facts and dates of our courses in water resources.


How to create a Schoeller plot online with Aquifer App - Tutorial

We present our own webapp for the representation of the Piper Diagram, Stiff Diagram and Scholler Diagram. The webapp was developed in Python Django and it is entirely free for everyone. The main objective behind this webapp was to develop a user friendly and minimum requirement tool to create these water quality / hidrogeochemical diagrams. The video tutorial shows the complete procedure to update the working file and then generate the diagrams.

Read More
Comment


Suscribe to our online newsletter

Subscribe for free newsletter, receive news, interesting facts and dates of our courses in water resources.


Thiem steady-state solution for confined aquifers in Aquifer App - Tutorial

Aquifer App, a web framework for application in hydrogeology now has a tool for the interpretation of the Hydraulic Transmissivity based on the Thiem solution. This is a perfect tool to parametrize homogeneous and confined aquifers on steady state flow conditions.

Read More
Comment


Suscribe to our online newsletter

Subscribe for free newsletter, receive news, interesting facts and dates of our courses in water resources.


Docker image containing the parallel version of MODFLOW 6 with application examples

Modflow on parallel processing seemed to lie in the far-off future, but now it’s possible to take advantage of most of your cores to run parallelized versions of MODFLOW 6. Since most MODFLOW modelers work on Windows we wanted to bring something more than a “packed” solution; our goal was to bring an enriched “packed” experience.

Read More
Comment


Suscribe to our online newsletter

Subscribe for free newsletter, receive news, interesting facts and dates of our courses in water resources.


Lithium speciation calculation on salt lake brines with Phreeqc and Python - Tutorial

Lithium interaction with the aqueous phase on brines phase is not well understood or at least not well covered by the scientific publications. To evaluate brine composition, brine dynamics and the interaction of the different components is really a challenge with the available tools for geochemical modeling as Phreeqc since it doesn’t appear in all the databases and in most it is only associated with sulfates.

Read More
Comment


Suscribe to our online newsletter

Subscribe for free newsletter, receive news, interesting facts and dates of our courses in water resources.


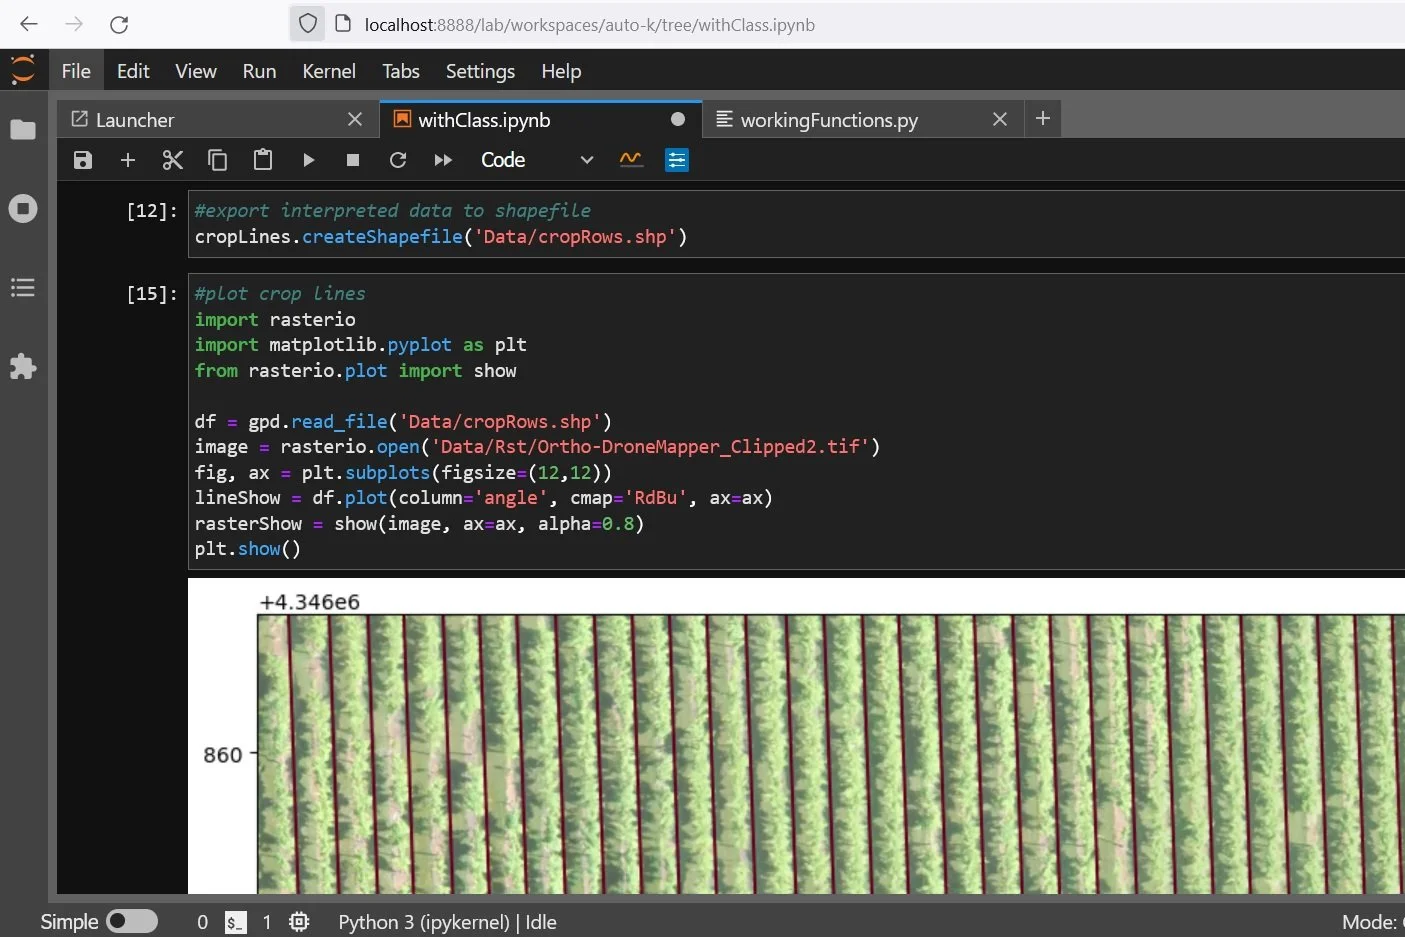
A Python class for crop line recognition with Rasterio and Scikit Image - Tutorial

The use of Python classes is a level of abstraction that allows us to store functions and variables in an effective way. With a Python class we can modify/repeat our analysis in Python without much effort.

We have done an applied example of crop line recognition using a Python class. The procedure uses a drone orthophoto and a shapefile of an area of interest, has options for the filter and creates a shapefile from the recognized lines. 


Tutorial


Input data

You can download the input data from this link.


Code

from workingFunctions import cropRecognition
import geopandas as gpd
# create a crop recognition object
cropLines = cropRecognition('Data/Rst/Ortho-DroneMapper_Clipped2.tif')
# refine band red=1 green=2 blue=3
cropLines.band = 2
#plot selected band
cropLines.plotBand()
#define canny filter sigma to represent
cropLines.cannyMin, cropLines.cannyMean, cropLines.cannyMax = 4,5,6 #1,2,3
#display different canny filters
cropLines.cannyFilterDisplay()
#define selected canny filter
cropLines.cannySigma = 6
#show canny filter array
cropLines.cannyFilter
array([[False, False, False, ..., False, False, False],
       [False, False, False, ..., False, False, False],
       [False, False, False, ..., False, False, False],
       ...,
       [False, False, False, ..., False, False, False],
       [False, False, False, ..., False, False, False],
       [False, False, False, ..., False, False, False]])
#perform hough transform for crop line recornition
cropLines.displayHoughTransform()
#define the geometry of the area of interest
aoi = gpd.read_file('Data/Shp/aoi.shp')
cropLines.aoiGeom = aoi.iloc[0].geometry
cropLines.aoiGeom
#create lines in the area of interest extension
cropLines.linesToAoi()
#export interpreted data to shapefile
cropLines.createShapefile('Data/cropRows.shp')
#plot crop lines 
import rasterio
import matplotlib.pyplot as plt
from rasterio.plot import show

df = gpd.read_file('Data/cropRows.shp')
image = rasterio.open('Data/Rst/Ortho-DroneMapper_Clipped2.tif')
fig, ax = plt.subplots(figsize=(12,8))
lineShow = df.plot(column='angle', cmap='RdBu', ax=ax)
rasterShow = show(image, ax=ax, alpha=0.5)
plt.show()


Comment

Saul Montoya

Saul Montoya es Ingeniero Civil graduado de la Pontificia Universidad Católica del Perú en Lima con estudios de postgrado en Manejo e Ingeniería de Recursos Hídricos (Programa WAREM) de la Universidad de Stuttgart con mención en Ingeniería de Aguas Subterráneas y Hidroinformática.


Suscribe to our online newsletter

Subscribe for free newsletter, receive news, interesting facts and dates of our courses in water resources.


Online tools for groundwater modeling preprocessing with Model Muse - Tutorial

If you want to speed up some steps in groundwater modeling you might be interested in the tools presented on this tutorial. We have developed some online tools that replace intense and time consuming tasks on desktop software and web servers and provide vector and raster data on the formats required by Model Muse. The tutorial covers the steps of DEM generation as Surfer Grid File (*.grd) with the definition of watersheds and river network based on two online services provided by Hatarilabs.

Read More
Comment


Suscribe to our online newsletter

Subscribe for free newsletter, receive news, interesting facts and dates of our courses in water resources.


How to split Modflow 6 groundwater model with Flopy and MF6Splitter - Tutorial

Modflow 6 has changed in many ways the traditional concepts of groundwater modeling; now a group of models can run under a "simulation" and these models can interchange flow and transport. Under this structure Flopy has implemented a tool to split a groundwater model into several models where their results can be reconstructed and compared to the original entire models. Capabilities and features like this make Flopy and Modflow 6 a great tool for developing advanced groundwater models that simulate complicated tasks or requirements to the groundwater flow regime.

Read More
Comment


Suscribe to our online newsletter

Subscribe for free newsletter, receive news, interesting facts and dates of our courses in water resources.


How to direct download / clip elevations and import them to Model Muse with Python - Tutorial

If you work often with numerical models this process will save you much time. The traditional method of downloading elevation models (Aster DEM) from websites, and reprojecting / clipping them with GIS software can be time consuming and pulls you out of other critical tasks on model conceptualization and calibrations. We have done a complete process in Python under WSL that runs Ubuntu in Windows, this platform was chosen due to the complexities of installing GDAL in Windows.

There are two scripts, one to download the images and the second to translate and clip the image. Finally the elevation are imported as a Surfer Grid File (*.grd) into a model in Model Muse.

Read More
Comment


Suscribe to our online newsletter

Subscribe for free newsletter, receive news, interesting facts and dates of our courses in water resources.


How to reproject, clip and interactively plot HDFs with Python and GDAL - Tutorial

Large amount of spatial data is indexed and delivered through files in Hierarchical Data Format (HDF). These files are compatible with desktop GIS software as QGIS but they are not so easy to open/read/process with standard Python libraries as Rasterio, or with dedicated libraries. On our research we found the spatial functionality on the powerful GDAL binaries and library for Python. 

Read More
Comment


Suscribe to our online newsletter

Subscribe for free newsletter, receive news, interesting facts and dates of our courses in water resources.


How to run Modflow 6 models on the background with Flopy, Linux and Nohup - Tutorial

If by chance you ended up working with large scale models with long execution times on JupyterLab you might find some restrictions related to the interface itself. Since the model execution is related to the session your computer can go into suspension before the process has finished or you need to keep a tab open to ensure the process is running smoothly. We have explored alternatives to run the model on the background, having some resources to reach the simulation progress and monitoring the process.

Read More
Comment


Suscribe to our online newsletter

Subscribe for free newsletter, receive news, interesting facts and dates of our courses in water resources.


Online crop counting from drone orthophotos with Hatari Utils - Tutorial

Orthophoto from drones provide us aerial imagery with spatial resolution in the scale of centimeters. With this high definition and cheap orthophotos we can interpret, analyze and quantify objects on a horizontal distribution by means of machine learning libraries for image recognition and cluster analysis.

Read More
Comment


Suscribe to our online newsletter

Subscribe for free newsletter, receive news, interesting facts and dates of our courses in water resources.


How to download Actual Evapotranspiration ET raster data (MYD16A2) with Python and Earthaccess - Tutorial

Evaluation of environmental processes requires a spatial temporal approach with the right tools to represent, process and analyze raster data. The process of satellite imagery selection on a web server is highly manual with limited options to manage an intensive amount of datasets. There are packages available to download certain Nasa imagery with Python, but the Earthaccess library allows users to download different dataset with options to login, select by time and location, and define folders to download data.

We have done a complete process to download actual evapotranspiration (MYD16A2) imagery with Python and Earthaccess for a given period and location. The files are stored in a folder and represented with QGIS.

Read More
Comment


Suscribe to our online newsletter

Subscribe for free newsletter, receive news, interesting facts and dates of our courses in water resources.


How to create a Piper plot online with Aquifer App - Tutorial

We present our own webapp for the representation of the Piper Diagram, Stiff Diagram and Scholler Diagram. The webapp was developed in Python Django and it is entirely free for everyone. The main objective behind this webapp was to develop a user friendly and minimum requirement tool to create these water quality / hidrogeochemical diagrams. The video tutorial shows the complete procedure to update the working file and then generate the diagrams.

Read More


Suscribe to our online newsletter

Subscribe for free newsletter, receive news, interesting facts and dates of our courses in water resources.


Online determination of Time of Concentration from a Raster DEM with Hatari Utils - Tutorial

Hatari Utils is our app for different hydrological analysis. The app provides the geometry of the basin, river network and main river as ESRI shapefiles and based on the output from the delineation we can determine the Time of Concentration under several formulas. The app also gives the mean and median of all time results.

Read More
Comment


Suscribe to our online newsletter

Subscribe for free newsletter, receive news, interesting facts and dates of our courses in water resources.