

How to make a map with QGIS - VIDEO
/Interesting tutorial that explains how to make a map with QGIS.
Read MoreInteresting tutorial that explains how to make a map with QGIS.
Read MoreThe Sentinel 2 satellites have a Multi-Spectral Instrument (MSI) with 13 spectral bands that range from the visible range to the shortwave infrared (SWIR). Bands come in variable resolutions from 10 to 60 meter and their wavelenght is determined based on specific purposes.
Read MoreThe NDVI (Normalized Difference Vegetation Index) is a versatile vegetation index to evaluate the vegetation and dynamic of the vegetation coverage change. This index has been studied and evaluated with many satellites over the years, changing its calculus method in relation to the number and type of bands of the satellite. The following tutorial shows the NDVI calculus for Landsat 8 images using QGIS.
Read MoreIf you need hydrogeology bibliography that includes topics like modeling, groundwater quality and remediation, the options are scarce. In this article we will show 8 excellent and recent groundwater books and a summary about them.
The following books have been bought by the author in bookstores or through websites. They all are in English and are in no particular order.
Read MoreSentinel-2 carries an innovative wide swath high-resolution multispectral imager with 13 spectral bands for a new perspective of our land and vegetation. The mission is based on a constellation of two identical satellites in the same orbit, 180° apart for optimal coverage and data delivery. Together they cover all Earth’s land surfaces, large islands, inland and coastal waters every five days at the equator (source ESA).
This tutorial show the procedure to download especific granules from a ESA Sentinel 2 Image using the website: https://scihub.copernicus.eu/
Read MoreSentinel-2 carries an innovative wide swath high-resolution multispectral imager with 13 spectral bands for a new perspective of our land and vegetation. The mission is based on a constellation of two identical satellites in the same orbit, 180° apart for optimal coverage and data delivery. Together they cover all Earth’s land surfaces, large islands, inland and coastal waters every five days at the equator (source ESA).
This tutorial show the procedure to download images of ESA Sentinel 2 from the website: https://scihub.copernicus.eu/
Read MoreOne of the most common tasks when working with Geographic Information Systems (GIS) is the representation of points from a spreadsheet to a shapefile. Here, we will explain the steps to achieve this.
Read MoreEvaporation is accomplished by removing water from the chemical system. Water can be removed as an irreversible reactant with a negative reaction coefficient in the REACTION keyword input. This example uses this method; the REACTION data block is used to simulate concentration of rain water by approximately 20 fold by removing 95 percent of the water. The resulting solution contains only about 0.05 kg of water. In a subsequent simulation, the MIX keyword is used to generate a solution that has the same concentrations as the evaporated solution, but has a total of mass of water of approximately 1 kg.
Read MoreThe study of the environment, the understanding of the water cycle / atmospheric processes and the interaction with the aquatic and terrestrial ecosystems need advanced analysis tools. It is important to understand how the environment works and the potential impacts of our actions in the future. This goes further than a regulatory approach, we need a constant search and evolution of codes and models and this is where open source software has important advantages.
This article shows the most important open source software that can be used to make the different sections of an EIA.
Read MoreQGIS development in the past years has been impressive for an open source software. The current version is 2.18 Las Palmas. Each version is better than the previous one when it comes to functionalities, amount of tools, and bug fixing. In my opinion, for an intermediate QGIS user, the amount of new tools are bigger than the ability to learn them. Being up to date with the latest QGIS characteristics requires quite some time.
Read MoreThe following video is a useful tutorial that shows you how to plot terrain profiles using QGIS. In this example, we used two raster files: (1) one representing the elevation of the water table and (2) another representing the elevation of the terrain.
Read MoreThe spatial analysis world is dominated by two software: ArcGIS and QGIS. Both have been available for years and have a strong fanbase. The use of each one of these software generates a duality or polarization of the preferences and opinions about Geographic Information Systems tools (GIS). This article is not about showing the advantages of deficiencies of any of them, but to show the reasons why QGIS is a good option.
Read MoreWe have looked for different water resources free software, checked their documentation and analyzed their advantages and deficiencies to get this top 12.
Read MoreThis example demonstrates the capabilities of PHREEQC to perform a series of geochemical simulations, with the final simulations relying on results from previous simulations within the same run. The example investigates diagenetic reactions that may occur in zones where seawater mixes with carbonate ground water. This example is take from the Phreeqc documentation that can be found here:
https://wwwbrr.cr.usgs.gov/projects/GWC_coupled/phreeqc/html/final-72.html
Read MoreThis tutorial is about the hydrological modeling at basin scale using different hydrological process as:
The tutorial uses the Soil Moisture Accounting method and compares the results with observed flow measurement on the basin.
Read MoreWorking with graphical user interfases (GUIs) can be slow when one wants to do a severe trial-error runs on a groundwater flow model. Pumping test intepretation requires a lot of attemps in order to calibrate the steady and transient parameters as hydraulic conductivity, vertical anisotropy, specific storage and specific yield.
This tutorial show a procedure to generate the modflow files and run them by scripts in Python. The process allows to setup a generic model for a pumping test interpretation where the pumping rates, and observed head can come in separate files or arrays.
Read MorePHREEQC version 3 is a computer program written in the C and C++ programming languages that is designed to perform a wide variety of aqueous geochemical calculations. PHREEQC implements several types of aqueous models: two ion-association aqueous models (the Lawrence Livermore National Laboratory model and WATEQ4F), a Pitzer specific-ion-interaction aqueous model, and the SIT (Specific ion Interaction Theory) aqueous model. Using any of these aqueous models, PHREEQC has capabilities for (1) speciation and saturation-index calculations; (2) batch-reaction and one-dimensional (1D) transport calculations with reversible and irreversible reactions.
This tutorial shows how to calculate the solubility and relative thermodynamic stability of two minerals, gypsum and anhydrit as a function of temperature at 1 atm.
Read MoreMODFLOW is a versatil and applied computer code written in Fortran capable of modeling groundwater flow on steady and transient conditions. MODFLOW can simulate a diverse sort of groundwater flow management cases due to its packages and solvers. This tutorial shows the application of MODFLOW for the simulation of radial drains in a mine tailings facility. The simulation considers 16 drains of 60 m length over a simulation period of 1000 days.
Read MoreThis example calculates the distribution of aqueous species in seawater and the saturation state of seawater relative to a set of minerals. To demonstrate how to expand the model to new elements, uranium is added to the aqueous model defined by phreeqc.dat.
Read MorePHREEQC version 3 is a computer program written in the C and C++ programming languages that is designed to perform a wide variety of aqueous geochemical calculations. PHREEQC implements several types of aqueous models: two ion-association aqueous models (the Lawrence Livermore National Laboratory model and WATEQ4F), a Pitzer specific-ion-interaction aqueous model, and the SIT (Specific ion Interaction Theory) aqueous model. Using any of these aqueous models, PHREEQC has capabilities for (1) speciation and saturation-index calculations; (2) batch-reaction and one-dimensional (1D) transport calculations with reversible and irreversible reactions.
Read MoreHatarilabs presents its educational program designed for mastering Python in real professional and academic environments. The program has an extensive practical work that goes from the basic concepts of Python, Numpy and Pandas to specific applications in water resources and geosciences coupled with geospatial analysis and machine learning.
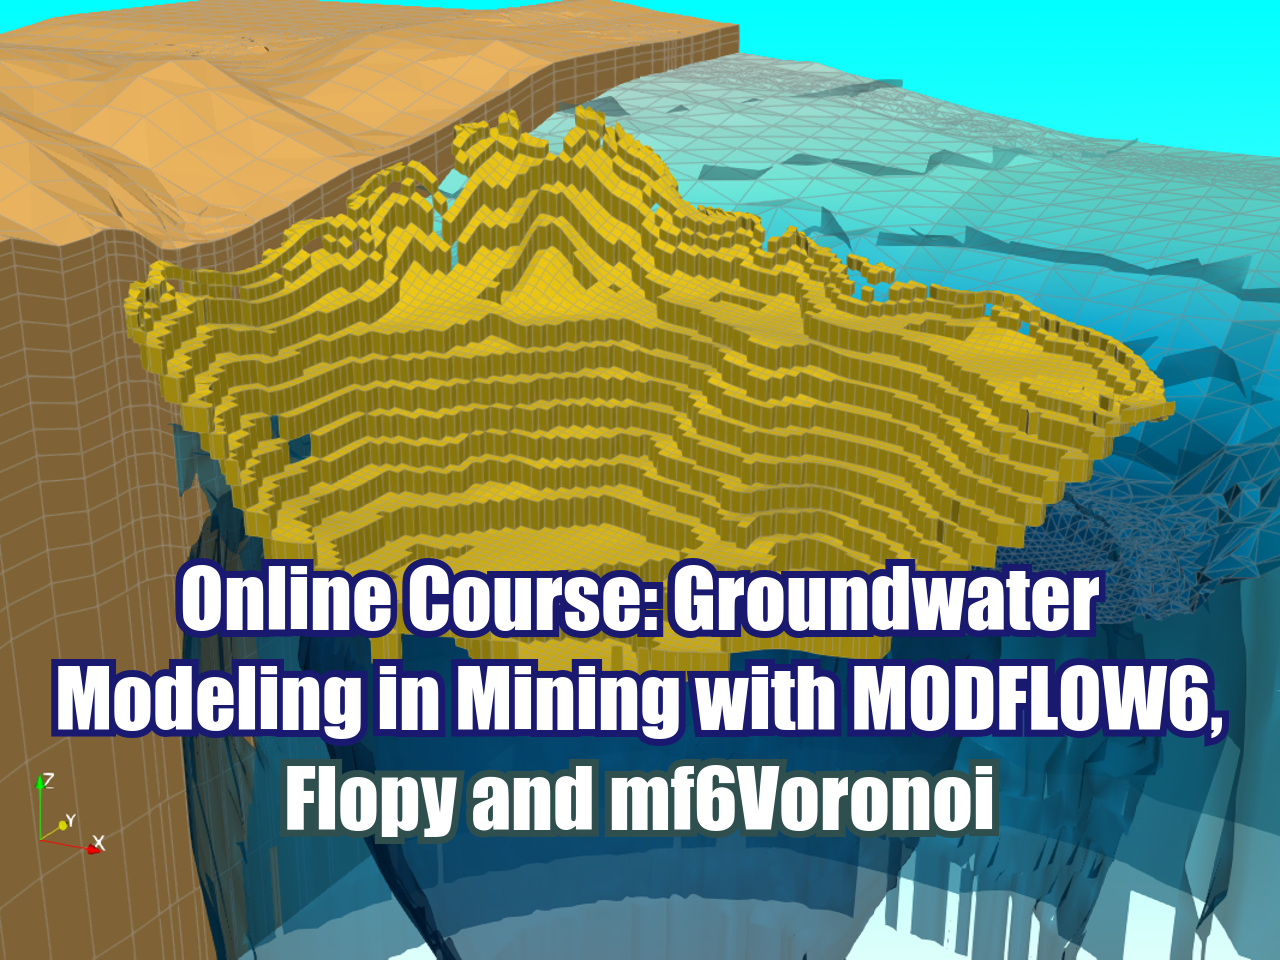
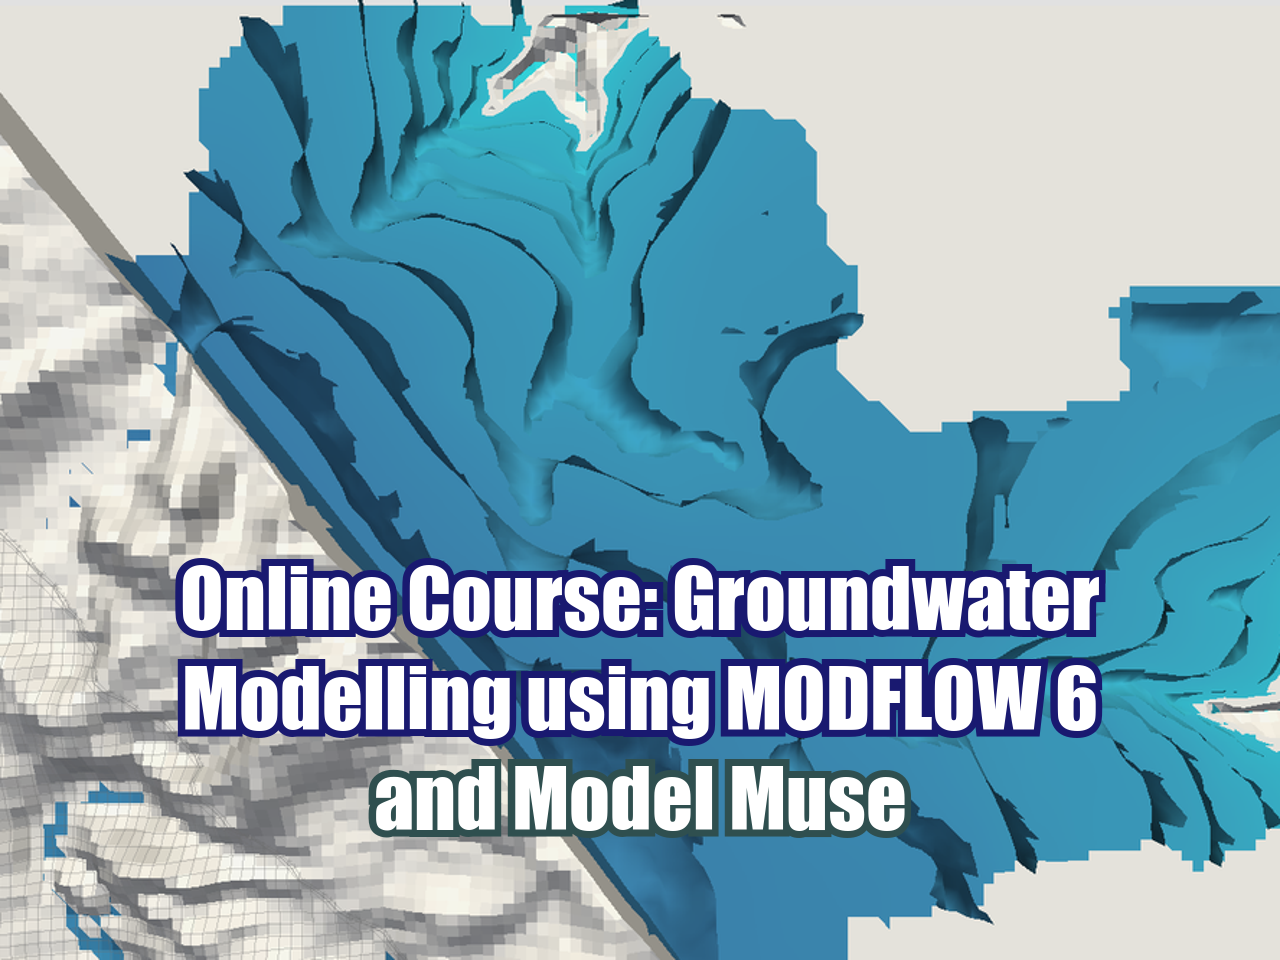
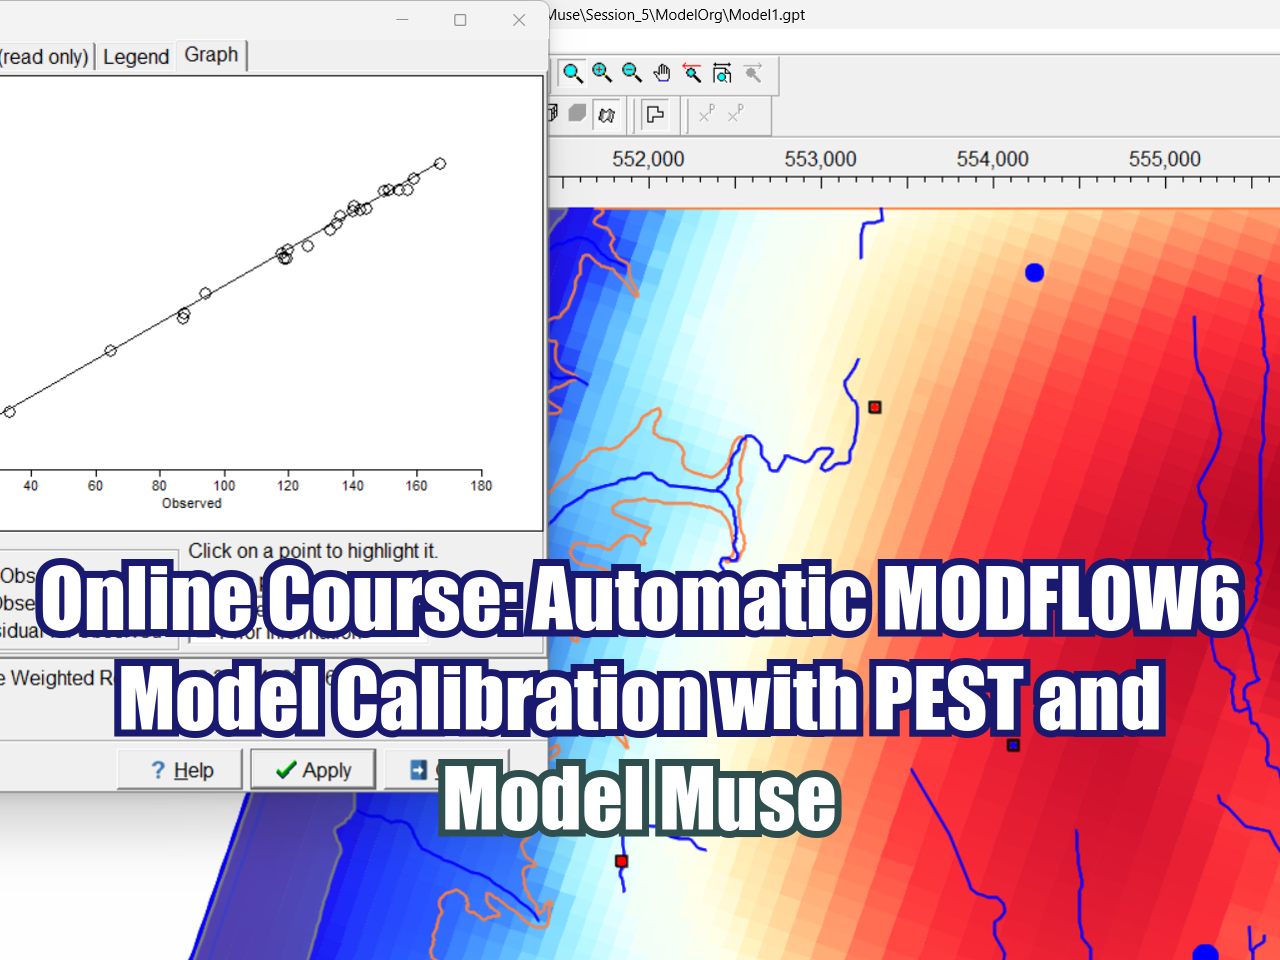
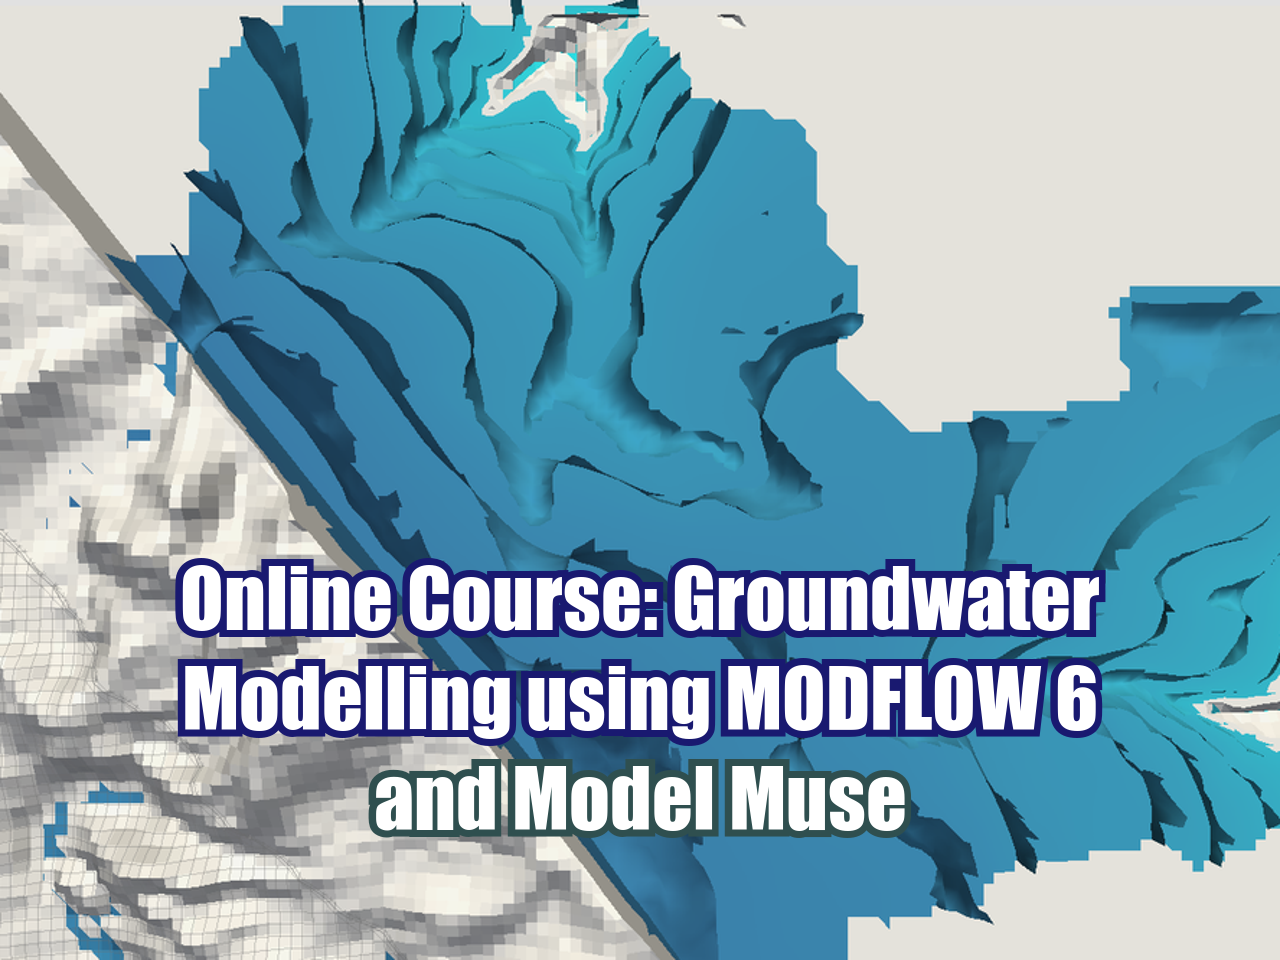
We have designed a complete program on MODFLOW with Model Muse that ranges from the essential topics in flow and transport modeling to applied cases of regional modeling, infrastructure projects, and seawater intrusion. MODFLOW with Model Muse is a recent open-source software that provides various tools for simulating the groundwater flow regime in different environments.
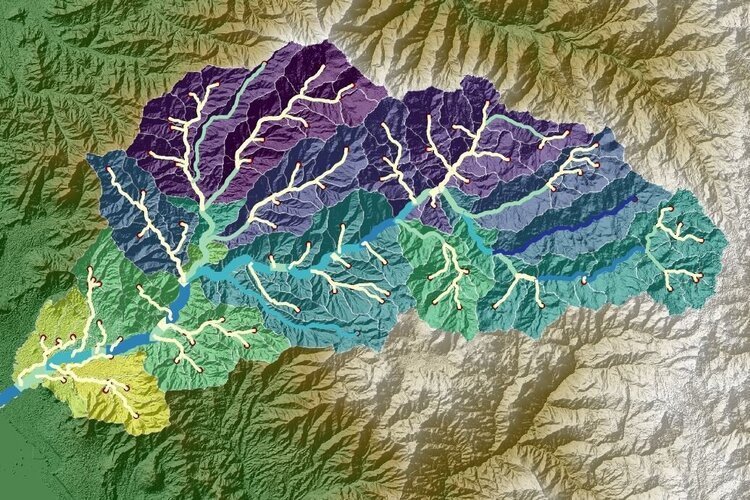
This program is designed to provide systematical learning from the most basic and general topics to intermediate and advanced topics, allowing the student to understand the various steps in developing hydrological models using the SWAT+ interface for QGIS. This program has a series of theoretical and practical concepts that allow the student to process spatial data, manage meteorological databases, build hydrological models, develop sensitivity analyses, and perform manual and automatic calibrations using versatile tools such as SWAT+ Toolbox, SQLite, and Python.

ONLINE COURSES:
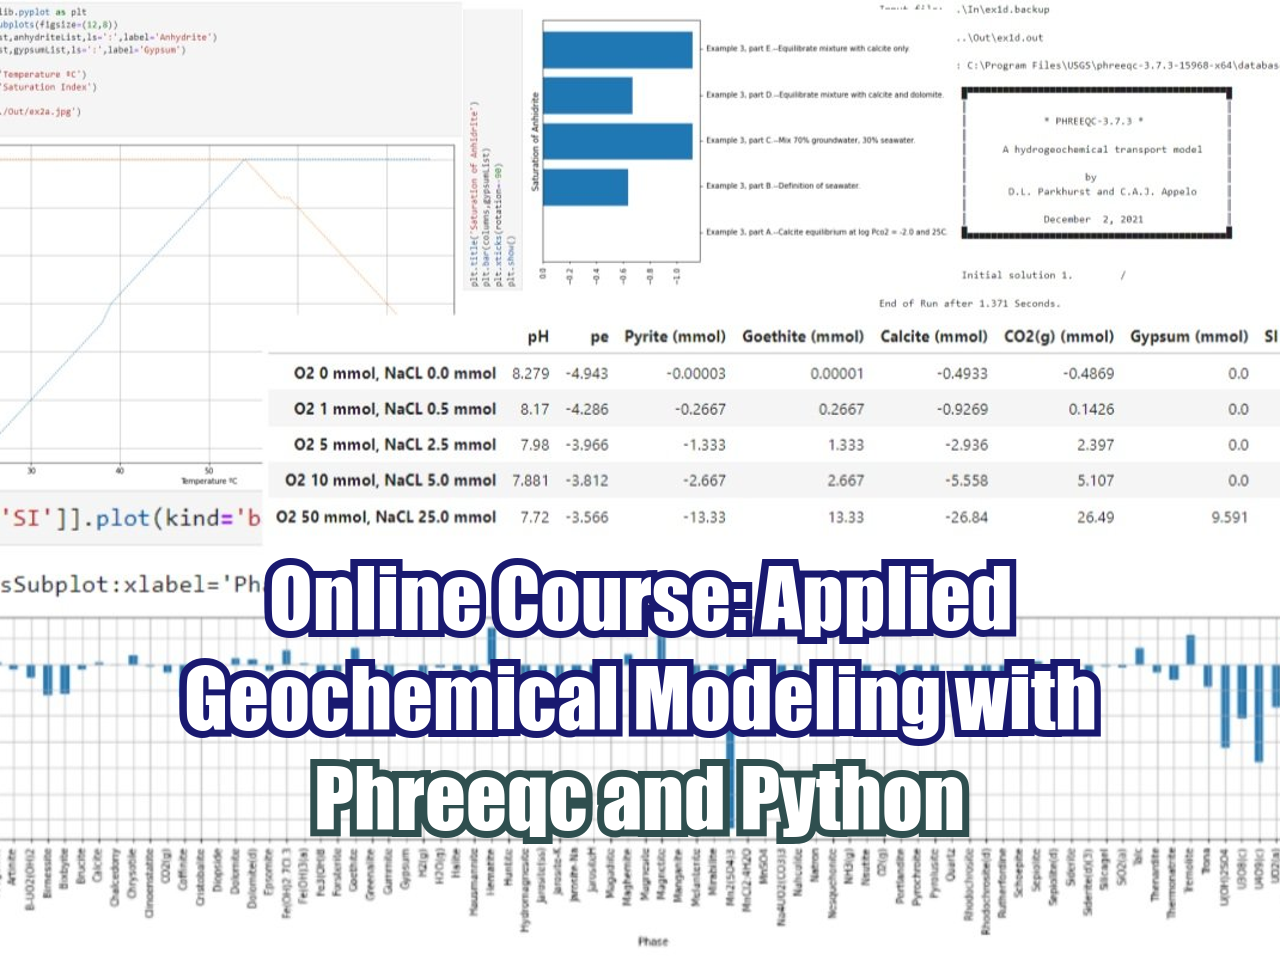
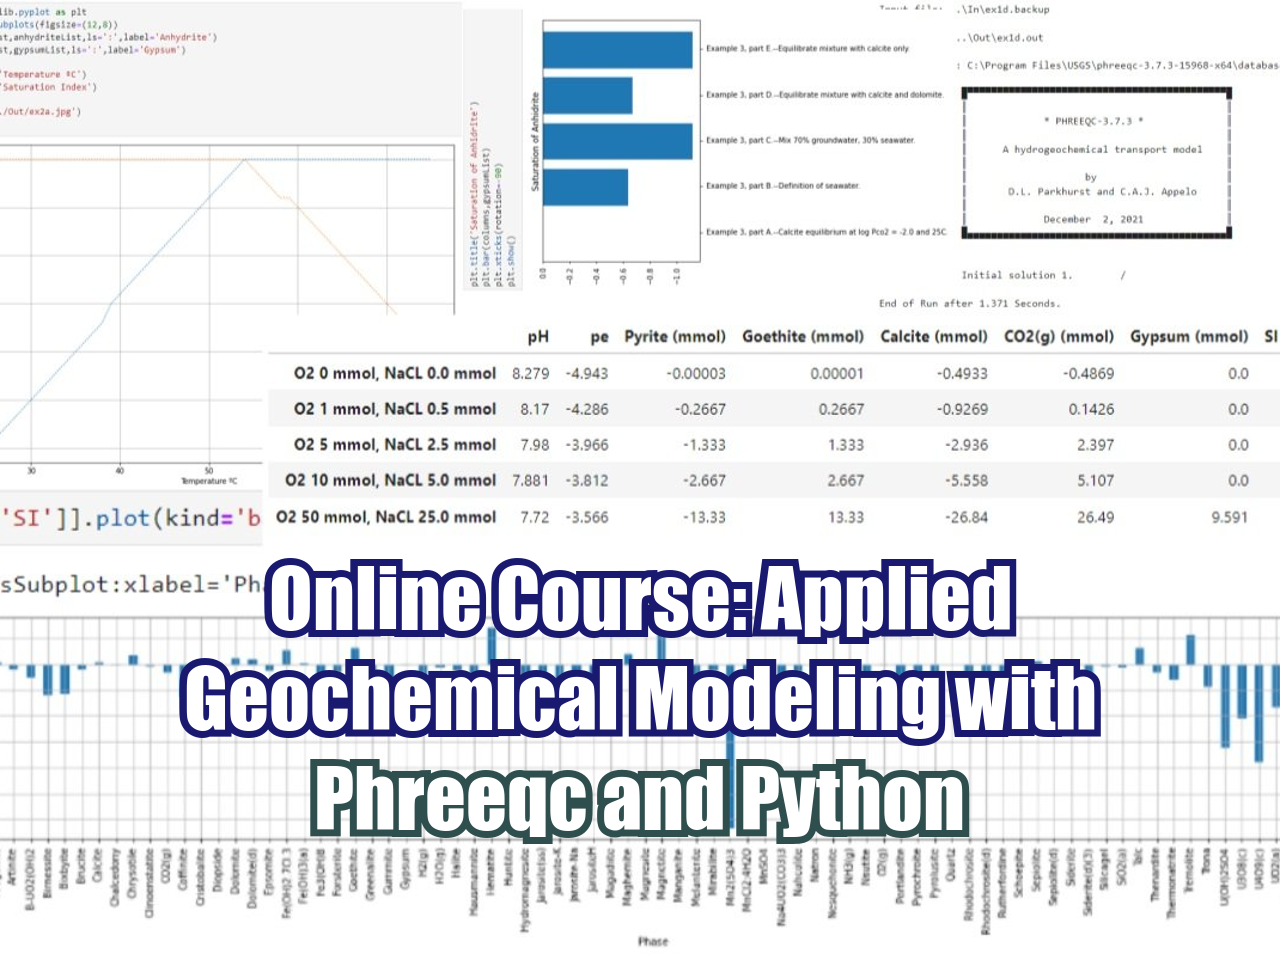
Phreeqc is a software developed by the USGS written in C++ capable of modeling a variety of aqueous geochemical processes such as mixing of waters, modeling equilibrium between solid and aqueous phase, modeling impact of temperature, calculation of element concentration among others.
Hatarilabs has developed an applied and unique course of Phreeqc integrated with Python undes a class (object type) that can run, parse and provide Phreeqc output as Pandas dataframes and integrate it to plots and further analysis with other Python libraries on a Jupyter notebook.
HEC-RAS is a software designed to perform hydraulic 1D and 2D calculations on river channels either natural or man constructed. It allows steady flow, unsteady flow, sediment transport and water quality modelling. It is developed by the US army corps of engineers, US Department of defence and it is openly available software. The HEC-RAS steady flow is based on one dimensional energy equation, while for the unsteady flow, HEC-RAS uses an implicit, finite difference method to solve the fully dynamic Saint-Venant equations.
The objective of HEC-RAS is to solve river dynamics and river engineering problems. Applications are delimitation of flood areas, embankment and protection work design, river restoration, emergency plans for dam break, optimization of hydraulic work and risk assessment and management.
This course develops the main functions and applications of the latest version of the MODFLOW 6 groundwater modeling code through the ModelMuse interface, both developed by the United States Geological Survey (USGS). This version includes innovative tools for the construction and simulation of hydrogeological models, mainly highlighting the incorporation of the discretization option for discretized by vertices grids.
The development of machine learning and geospatial libraries in Python as Scikit Image, Rasterio and Fiona gave us a new range of tools to analyze vegetation from traditional sources as satellite imagery and new sources as drone orthophotos. The appliance of Python programming for crop identification depends on many factors such as the image resolution, the vegetation stage and even the algorithm setup.
We have developed a course crop identification / delineation with geospatial and machine learning tools of Python, the course is aimed to GIS or related professionals that have basic Python knowledge. The course covers the introductory concepts of the geospatial libraries and a series of machine learning applications for crop indentification in olive trees, palms, agave and corn fields.
Note:
This course is for professionals with previous knowledge of Python. Basic concepts of Python programming will not be covered in the lessons and course material. In case you don’t have any knowledge of Python, we recommend you to take this online course.
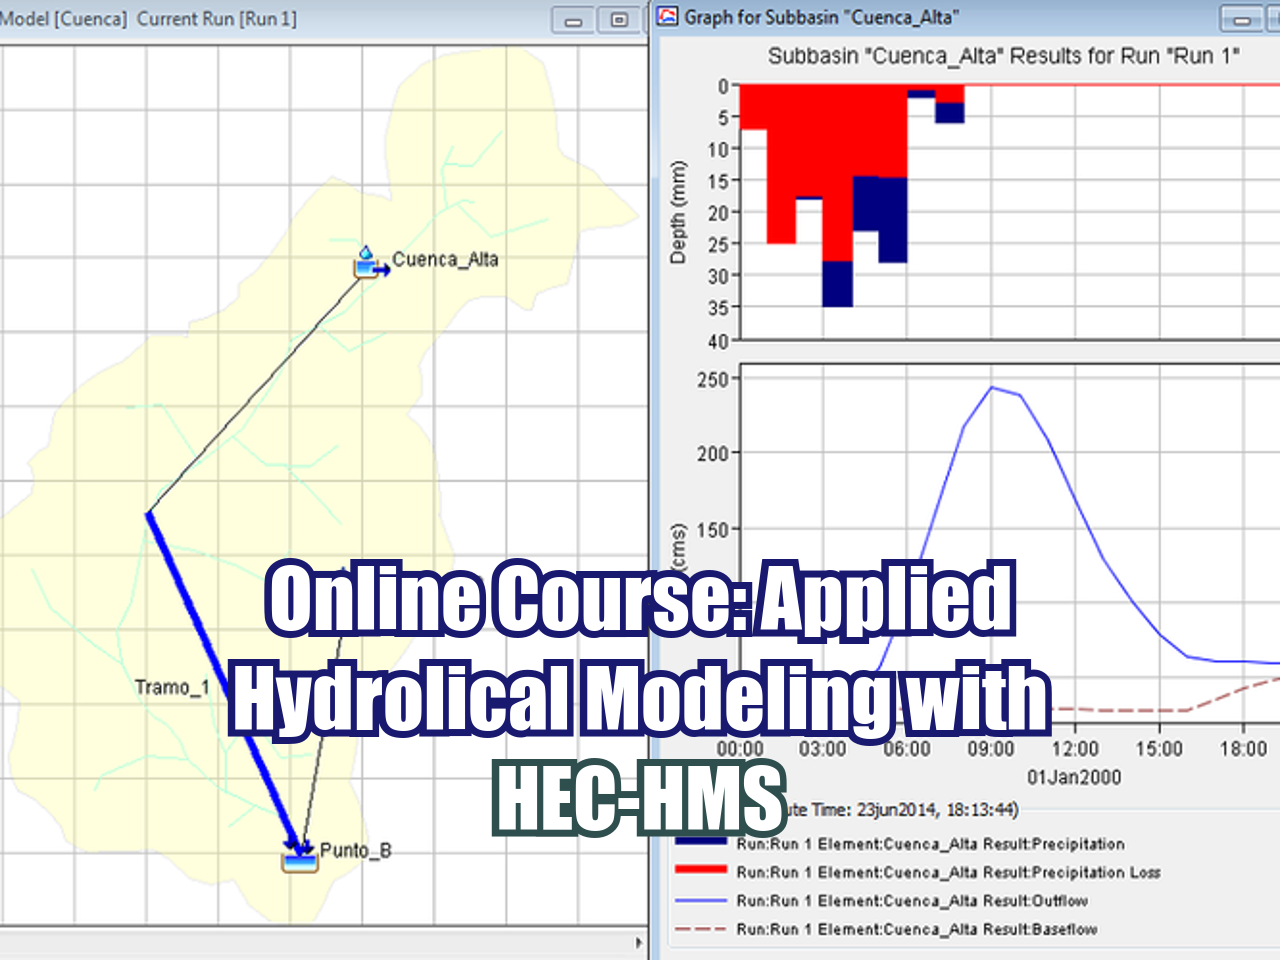
The Hydrologic Modeling System (HEC-HMS) is a free program developed by the US Corps of Engineers that implements a series of hydrological methods to represent different physical processes of the water cycle.
HEC-HMS also includes procedures necessary for continuous simulation including evapotranspiration, infiltration, hydrological routing and soil moisture accounting. The tools and options of HEC HMS make it a very versatile and powerful software for the hydrological simulation of different scenarios such as extreme events in arid regions, or water balances in wet climates.
Hatarilabs offers the online course of Hydrological Modeling with HEC-HMS for students and professionals of any country. The course is focused on theory and practical to know the different HEC-HMS tools and its application to the hydrological modeling.
Hatarilabs offers the online course of Hydrological Modeling with QSWAT for students and professionals of any country. The course is focused on the acquisition and preprocessing of data for SWAT+ using QGIS 3.4 for develop hydrological watershed modeling.
This course covers the whole procedure of developing regional groundwater models through the ModelMuse interface, including the model construction, boundary conditions, parameter assignment, model simulation, results analysis and visualization, and model calibration. Flopy is also introduced in the course to import, create, refine and simulate the model as in ModelMuse. Two basins with different aquifer setting and boundary conditions are used as case studies to demonstrate the use of these tools so that the participants learn how to build these models and analyze the results for future decision-making.
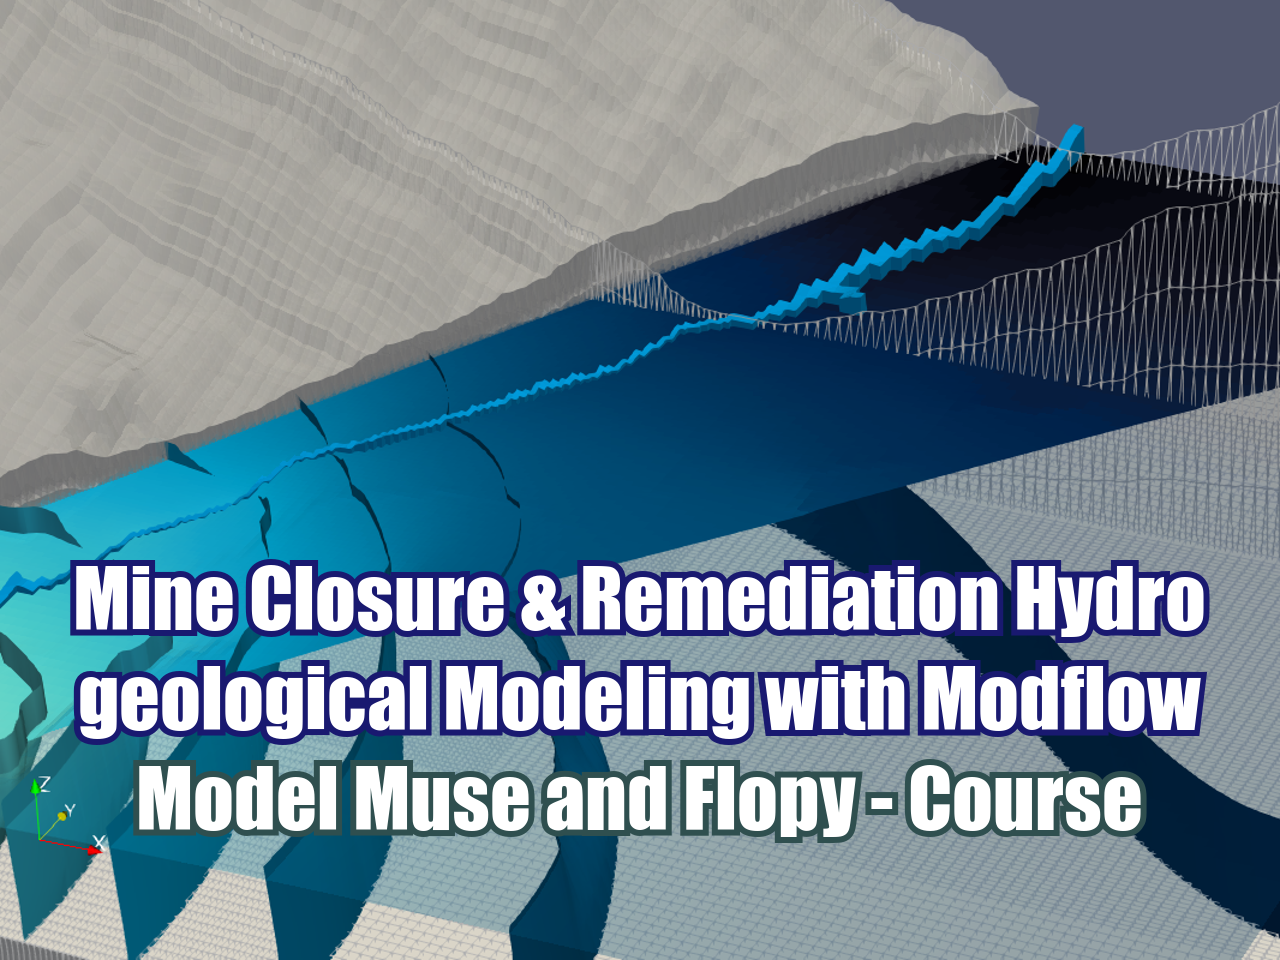
Evaluation of long term impacts of the mining activity is a key topic on the public concern and regulatory and sustainability policies. Due to the scale of the mining projects and the different related activities, impacts could be made to several parts of the physical environment. Groundwater modeling is a useful tool for the simulation of mine closure impacts to the groundwater flow system and groundwater quality. Hatarilabs has developed an applied course about the simulation, calibration, representation and impact analysis of a waste dump closure on the environment and water bodies with a long term scope (closure and post closure). The course will be given on Model Muse for flow and contaminant transport modeling and scripts in Flopy for model calibration, water balance analysis and evaluation of remediation techniques performance.
This course is focused on how to use the different packages related to numerical tools, data analysis, representation of graphs, and others. Many of these tools are applicable to the field of Hydrology in the preparation of data for hydrological models, statistical analysis of hydrological parameters and model result representation.
Graphical user interfaces (GUIs) are commonly used to construct and post-process numerical groundwater flow. Flopy is the Python library that builds and executes MODFLOW models; this library has tools and options for the complete geo-referencing of a MODFLOW model.
Python is a simple and powerful programming language; its simplicity is remarkable compared to other programming languages and its power is based on the number of tools available for different areas of study.
Use of Python with the available scientific packages and FloPy, facilitates data exploration, alternative model evaluations and model analyses that can be difficult to perform with GUIs. One advantage of Flopy and Python is that there are many packages available to facilitate the model development process, including packages for plotting, array manipulation, optimization, and data analysis.
This course allows acquired knowledge of the open source programming language to construct model input files, run the model, and read and plot simulation results.
LATEST POSTS
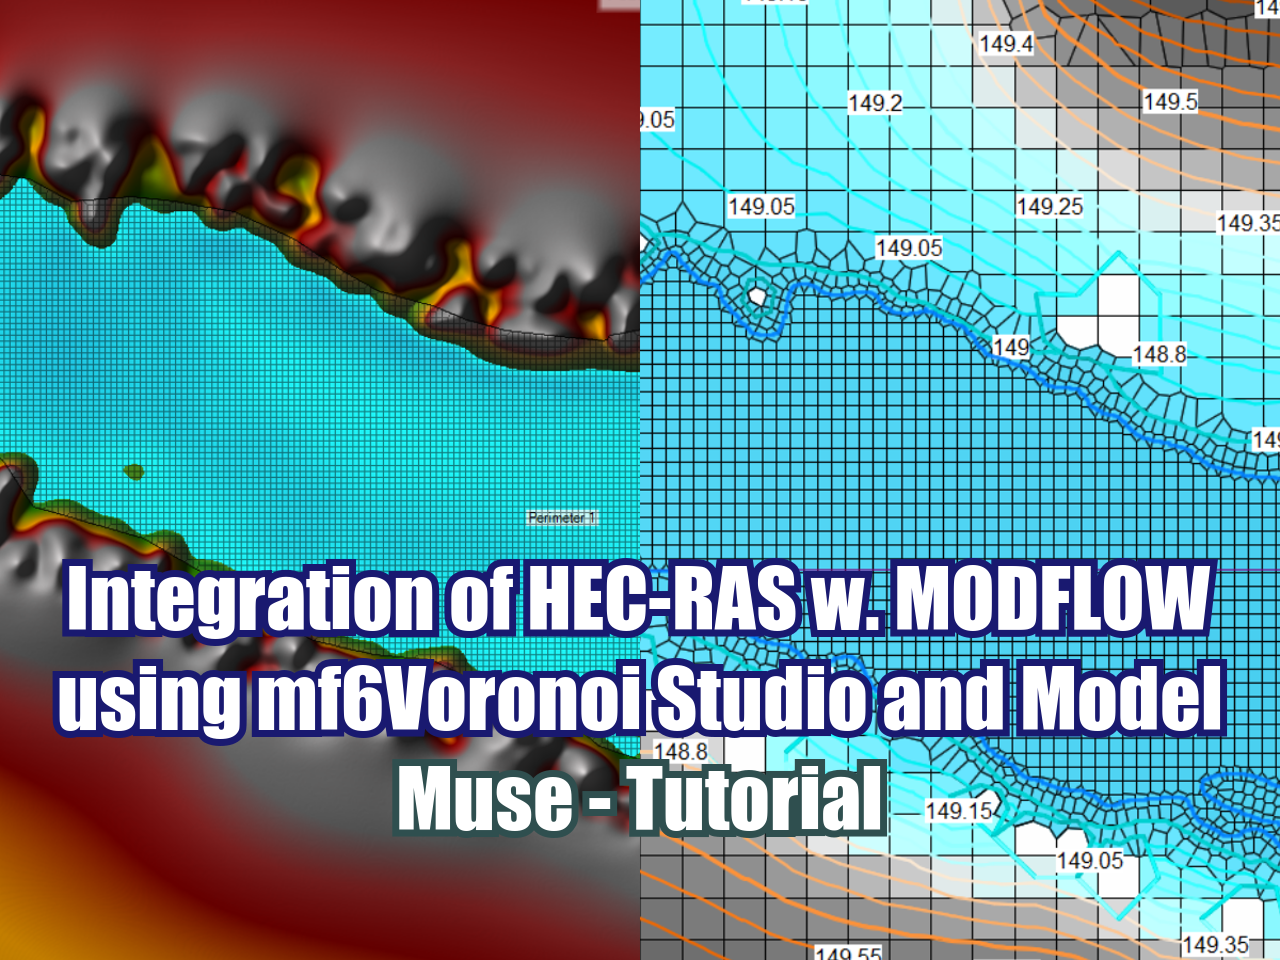
In this tutorial on the integration of HEC-RAS with MODFLOW using mf6Voronoi Studio and Model Muse, we will develop a complete step-by-step practical example, starting from an already built unsteady model in HEC-RAS from which we will export key depth and hydraulic elevation data for a specific datetime, information from which we will generate the optimized simulation voronoi mesh that we will later import into ModelMuse to structure our groundwater model incorporating River and General Head Boundary (GHB) boundary conditions, concluding with a detailed analysis of the distribution of hydraulic heads and the evaluation of the dynamic interaction between the different sections of the river and the aquifer system.
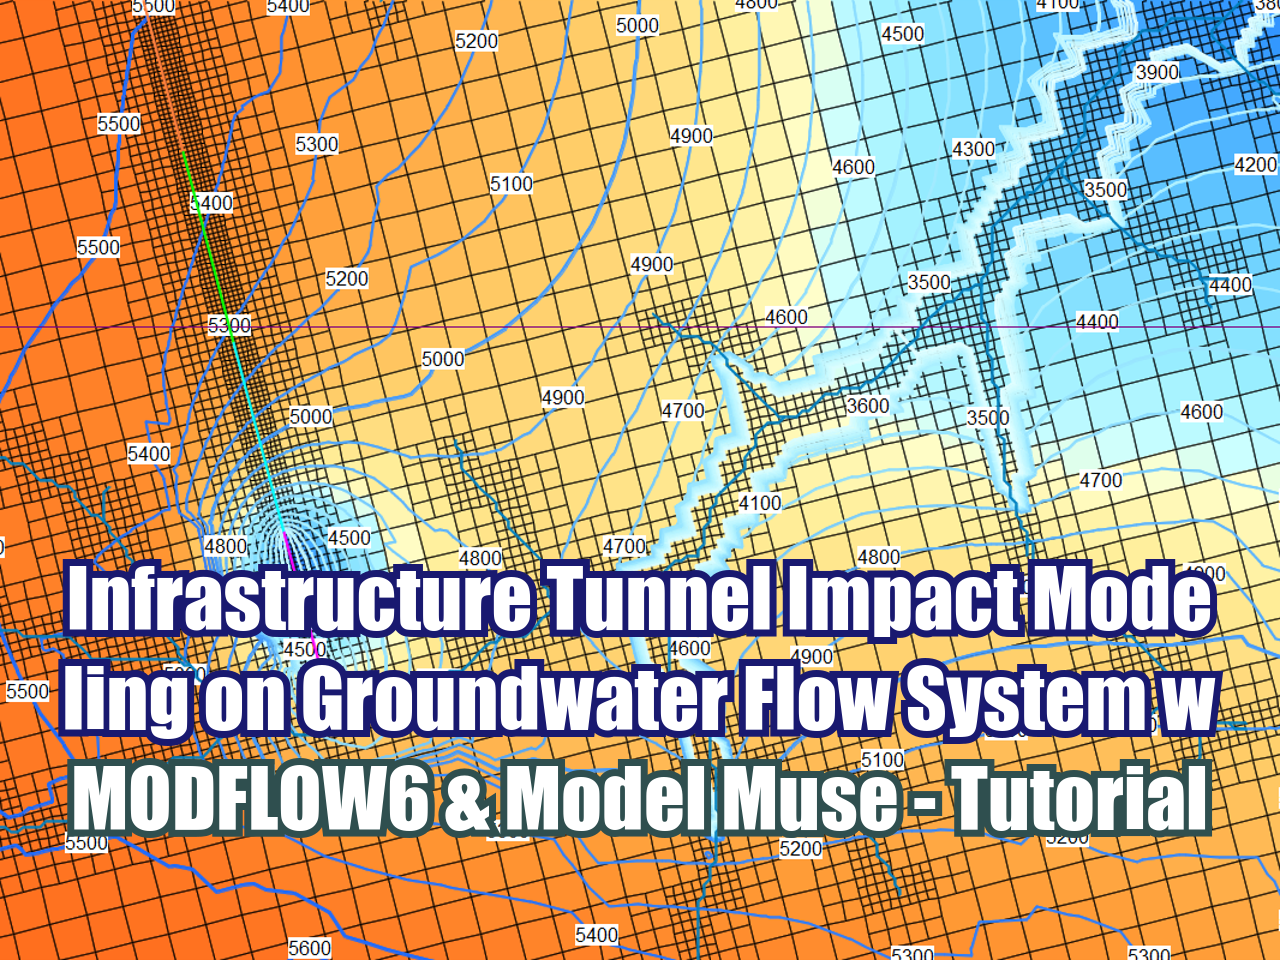
This tutorial demonstrates how to model the hydrogeological impact of an infrastructure tunnel on a regional groundwater flow system using MODFLOW 6 and Model Muse. The exercise simulates a four-year tunnel excavation process through a mountainous terrain bounded by two creeks, evaluating how gradual underground construction affects local water table levels and regional flow dynamics. The model uses an unstructured discretization grid (DISV) with Quadtree refinement along the river and tunnel paths, also the model incorporates local geology, dynamic drain boundaries, and transient stress periods to capture the groundwater system's response over time.
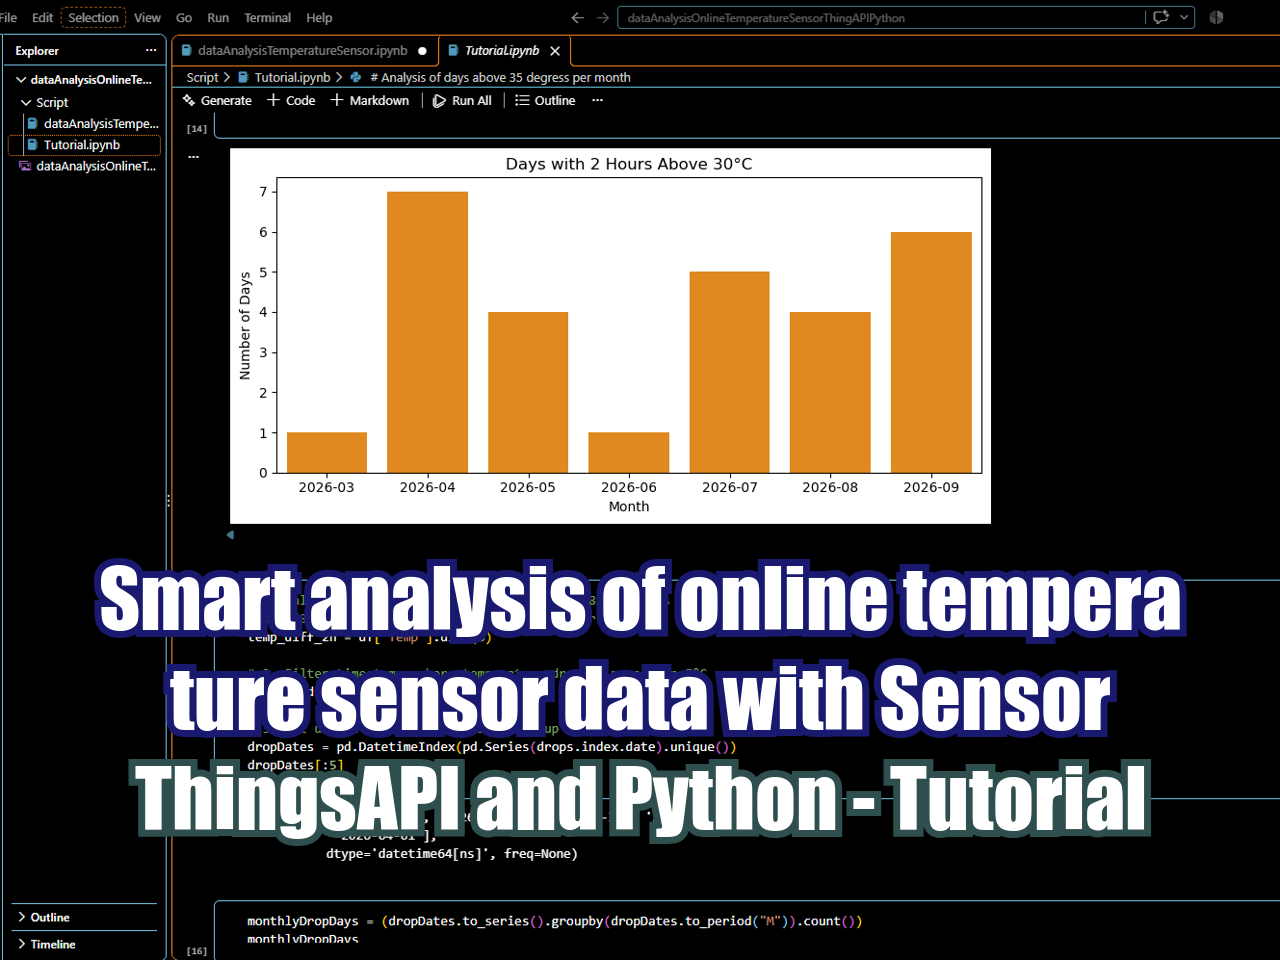
This tutorial demonstrates how to connect to a SensorThings API FROST server using Python to retrieve, inspect, and visualize IoT sensor datastreams. After setting up the server connection and querying datastream details such as units and observation counts, the notebook extracts time-series observations using paginated REST requests and loads them into a Pandas DataFrame. Following the data preparation phase, the script produces a series of continuous time-series line charts using Matplotlib and Seaborn, displaying the chronological trend of air temperature measurements recorded over time.
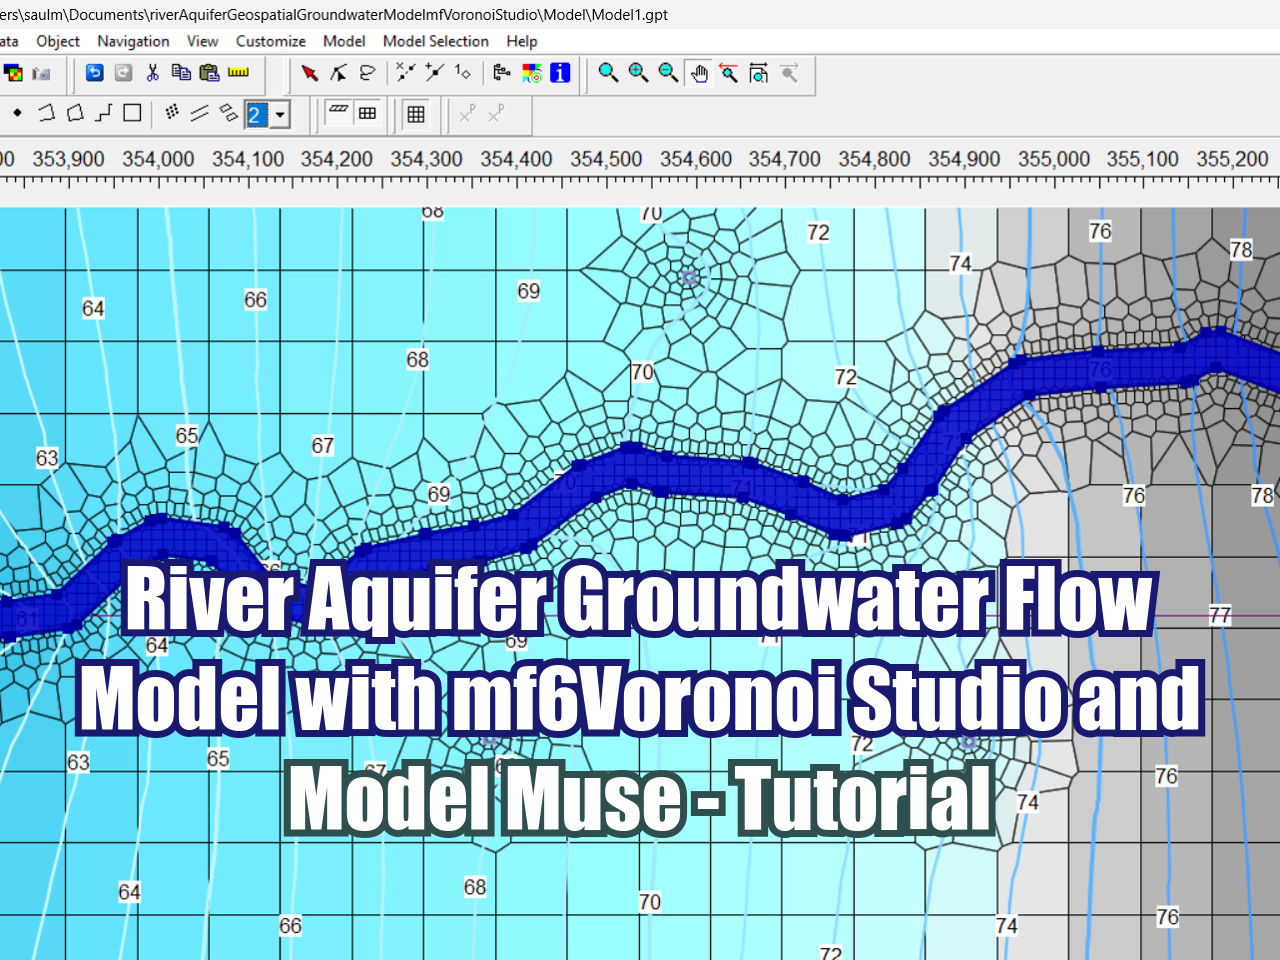
This tutorial demonstrates how to build and simulate a groundwater model focused on river-aquifer interactions using open-source software. The workflow begins in mf6Voronoi Studio, where a Voronoi grid mesh is generated to capture complex spatial geometries efficiently. The mesh is then imported into ModelMuse, where key aquifer properties and essential boundary conditions—including general head, river, well, recharge, and evapotranspiration—are configured. After running the model, the simulated results are evaluated through an analysis of the water balance and head distribution.
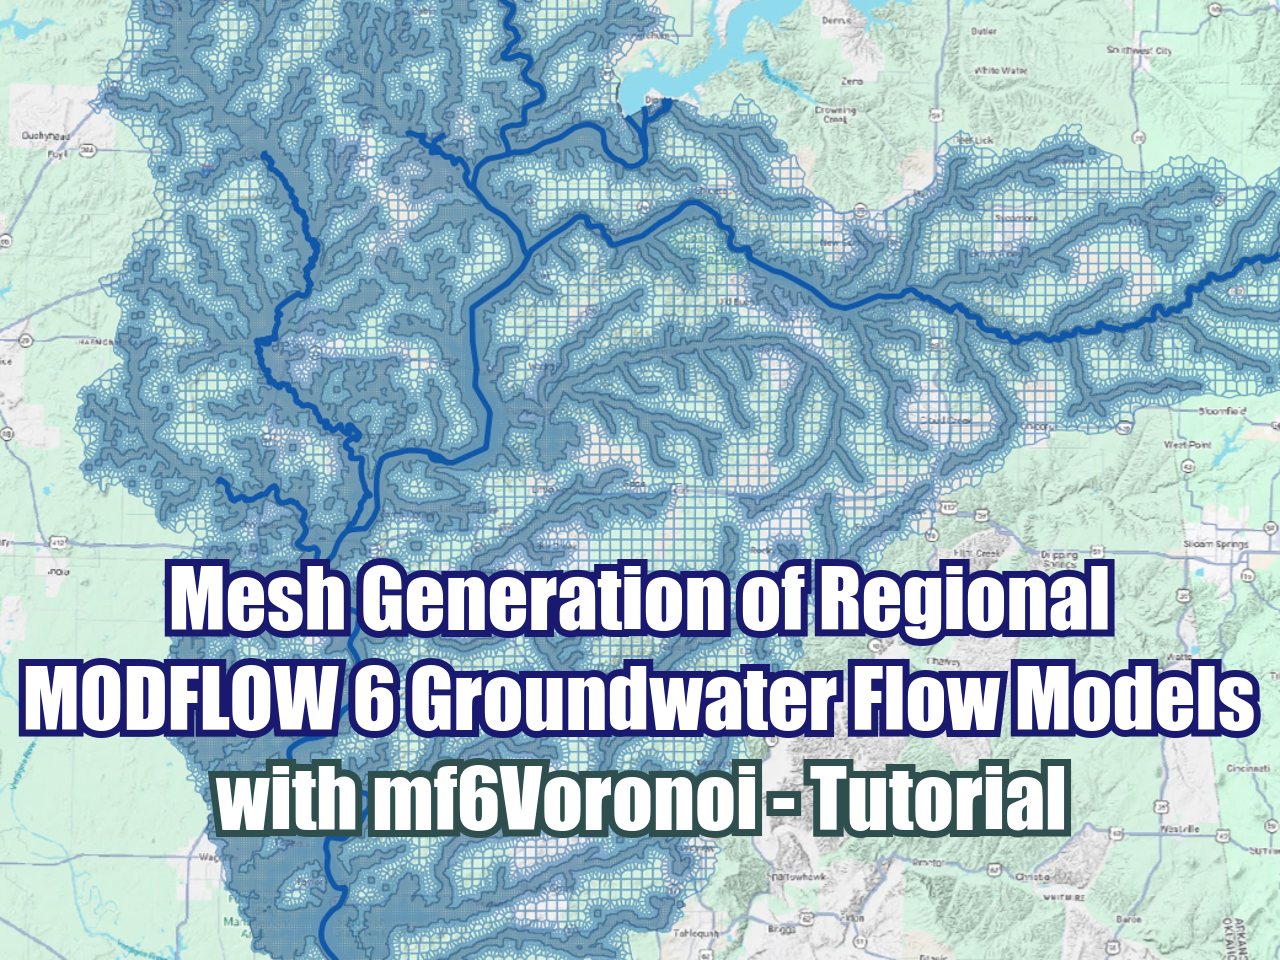
In this tutorial we introduce mf6Voronoi, a specialized tool for generating optimized Voronoi meshes for regional groundwater models capable of spanning thousand of square kilometers. The video demonstrates how to set up and run a Python script using Anaconda Prompt, leveraging Dask parallel processing to refine mesh resolution along key rivers and riparian ecosystems while maintaining a coarse discretization elsewhere. By utilizing multi-core computing, the workflow reduces total mesh generation time by approximately 40–45%, delivering a high-resolution, multi-scale MODFLOW 6 mesh consisting of over 150,000 cells in just a few minutes.
SEARCH



 |
 |
 |
 |
 |
 |

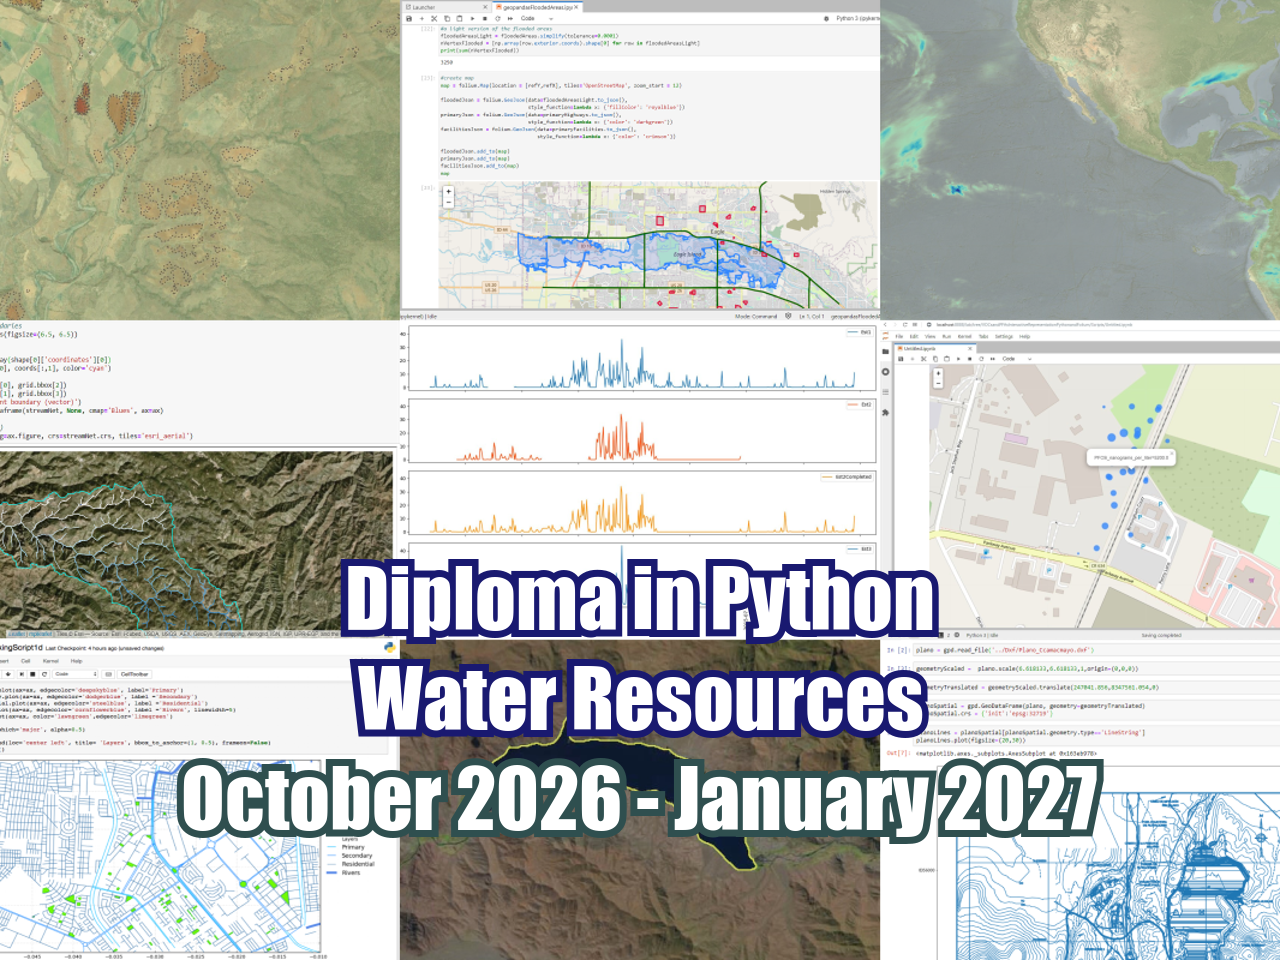





FloPy is the Python library that builds and executes MODFLOW models; this library has been enhanced to provide full support of MODFLOW 6 with most of its recent development is related to functionality for MODFLOW 6, tools to use vector and raster spatial data and common plotting and export functionality.