Modeling of Air Pollution caused by Atmospheric Effluents (Chimneys) with OpenFOAM

The preservation of air quality requires the characterization and evaluation of impacts produced by point sources that emit contaminants and its interaction with wind, climate conditions and zone geometry. Current evaluation tools as AERMOD only offer 2D evaluation with Gaussian dispersion, while the nature of air contaminant dispersion is a 3D phenomenon with thermodynamic components and interactions with terrain geometry.

Read More

Determination of Mining Projects Areas with Satellite Imagery and QGIS

Our current working conditions require access to spatial information in short periods of time. Work planning tasks or quoting of services require data of distances, areas, proximities, medium elevations, among others. The data can be given by clients, organizations or by field monitoring, but they may not be available at the required moment. The use of geoprocessng tools of satellite imagery reduces the required time to have this information. Since QGIS is open source and the Landsat, MODIS and Aster images are free, this type of geoprocessing is versatile, economic and friendly for any user with basic/intermediate QGIS knowledge.

Read More

Tutorial: How to convert MODFLOW-2005 files to MODFLOW-6 format

The United States Geological Survey (USGS) has just released a new MODFLOW version: MODFLOW-6. This one comes with new functionalities to make it easier to create input files and perform simulations. Among the downloaded MODFLOW-6 files, there is an executable file to convert MODFLOW-2005 files to the new MODFLOW-6 format. In this tutorial we will show you how to do this.

Read More
Modeling of Mine Tailings Dam Failure with OpenFOAM - Tamboraque Site - Videos

Tailings dams are supposed to last forever but they fail regularly due to a series of factors related to the construction and maintenance of the mine site. Accoring the cronology of mayor tailings dam failures of WISE Uranium Proyect there has been one mayor failure in 2017, two on 2016 and the last one in South America was on 2015 in Minas Gerias - Brasil. 

This article show the numerical modeling of a tailings dam failure relate to the Tamboraque site in Peru andes. The model represents the dynamic transport of tailings material as a non-newtonian fluid. Model was developed using high-end open source software as OpenFOAM, Salome Platform and QGIS.

Read More

Tutorial to Generate Orthophotos from Drone Images with WebODM

Drone imagery is a powerful for geospatial analysis on small scales and high resolutions. The availability to take drone images and the open source tools available allow the user to generate orthophotos with resolutions of less than 1 meter and fully compatible with SIG softwares as QGIS.

This tutorial show the procedure to make an orthophoto with WebODM based on drone images from a pinneapple field.

Read More
How to install Web OpenDroneMap (WebODM) in Windows with Docker

WebOpenDroneMap is a friendly Graphical User Interfase (GUI) of OpenDroneMap. It enhances the capabilities of OpenDroneMap by providing a easy tool for processing drone imagery with bottoms, process status bars, and a new way to store images. WebODM allows to work by projects, so the user can create different projects and process the related images.

As a whole, WebODM in Windows is a implementation of PostgresSQL, Node, Django and OpenDroneMap and Docker. The software instalation requires 6gb of disk space plus Docker. It seem huge but it is the only way to process drone imagery in Windows using just open source software. We definitely see a huge potential of WebODM for the image processing, therefore we have done this tutorial for the installation and we will post more tutorial for the application of WebODM with drone images.

Read More
VIDEO: Webminar on Satellite Imagery Analysis with QGIS - May 10, 2017

Satellite Imagery has developed a new dimension in the evaluation of water resources, environment, land planning, atmosphere and climate change. There are many satellites and imagery available, many of them being free of cost. At the same time, powerful open source tools for spatial analysis and representation are available.

This webminar wants to give a perspective on search, manage and interpretation of satellite imagery, through practical exercises using QGIS.

Read More
Tutorial: Dynamic Flood Simulation using HEC-RAS 5.0

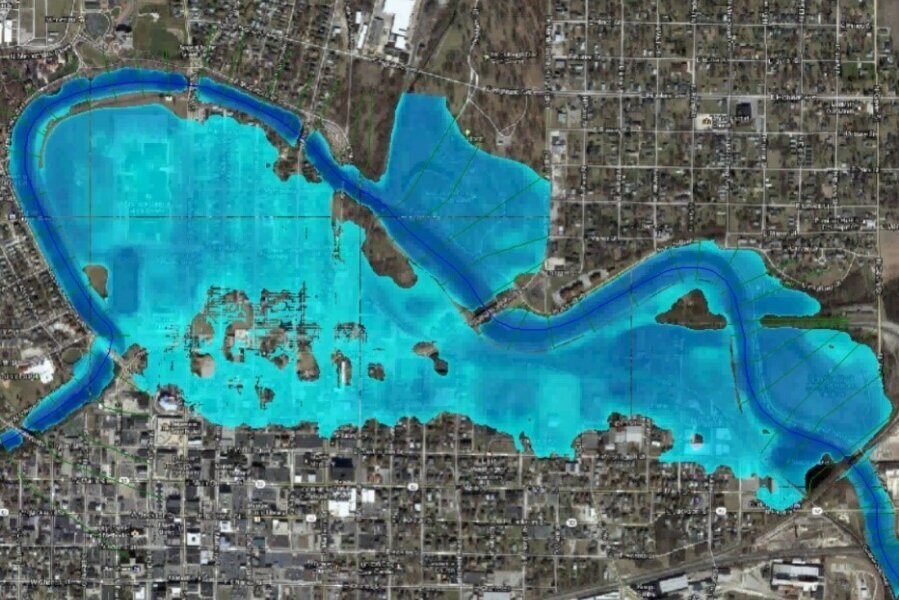
HEC-RAS is a software developed by the U.S. Army Corps of Engineers for the simulation of superficial flow and has applications for hydraulic design, floods, sediment transport  and water quality.

This tutorial will show how to use the new features of HEC-RAS regarding 2D flood modeling. It will start with the importing of a DEM, grid and boundary conditions conceptualization and the configuration of simulation.


Steps

1. Open HEC-RAS

2. In the main window, select File > Create new project. Give a name for the project and click OK.

3. You will be asked about the units system. In this case we will use SI Units. Click Accept.

4. Choose the the RAS Mapper icon as shown below:

5. In the RAS Mapper window, right click on Terrain > Create a new terrain.

6. You will be asked about setting the Spatial Reference System. In this case we will select No.

7. Click on the "+" icon and select the DEM. In this case we have the Mashhad-DEM_cut.tif. After selecting the file, you will be asked if you want to use its spatial reference projection for this model. Click Yes.

8. Click Create and wait.

9. Exit the RAS Mapper and select Edit > Geometric Data on the main HEC-RAS window.

Captura8.PNG

10. In the Geometric Data window we will see the DEM we previously uploaded. Select the 2D Flow Area and draw a polygon similar to the one shown below, it will define the area of the model. When you are finished drawing, you will be asked to enter a name for the 2D Flow Area.

11. Select the SA/2D Area BC lines option. Draw the first boundary condition, which will correspond to the Upstream of the river, and then the Downstream boundary condition as shown in the following image. After finishing drawing each one of them, you will be asked to give it name.

Captura10PNG.PNG

12. Select the area, right click and click Edit 2D Flow Area.

Captura11.PNG

13. In the following window,  click on the option Generate Computation Points on Regular Interval with All Breaklines. Change the Spacing DX and DY to 20 and then click Generate points in 2D flow area. Finally, click Force mesh recomputation.

Captura13.PNG

14. To save this Geometry: File > Save geometry Data As.

15. In the main HEC-RAS window, go to Edit > Unsteady Flow Data.

16. Here, we have to associate Boundary Conditions types. For the Downstream BC choose Normal Depth and a Friction Slope of 0.02.

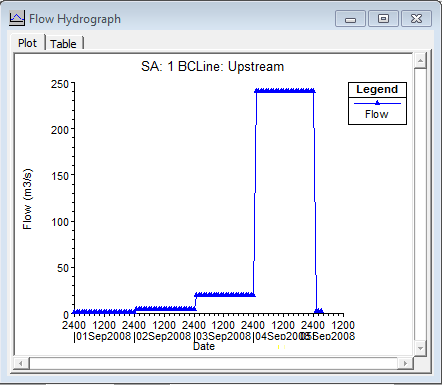
17. For the Upstream BC choose Flow Hydrograph. For this example, the simulation will start on 01 Sept 2008 at 00:00. The flow considered for 01 Sept. is 1 m3/s, 4 m3/s for 02 Sept., 20 m3/s for 03 Sept., 240 m3/s for 04 Sept. and 2 for 05 Sept. Fill all the data required.

18. In the Unsteady Flow Data window, go to File > Save Unsteady Flow Data.

19. In the HEC-RAS main window, select Run > Unsteady Flow Analysis. Select the options as shown here, and click Compute.

20. Finally, to access the results, go to the RAS Mapper and activate the results you want to visualize, like Depht, Velocity or WSE. You can click the Play button and see how the values vary with time. 

Files

Download the files here.

Saul Montoya

Saul Montoya es Ingeniero Civil graduado de la Pontificia Universidad Católica del Perú en Lima con estudios de postgrado en Manejo e Ingeniería de Recursos Hídricos (Programa WAREM) de la Universidad de Stuttgart con mención en Ingeniería de Aguas Subterráneas y Hidroinformática.

An overview of Freewat, the new MODFLOW interface in QGIS

A new and fresh opensource preprocessing and post processing tool is available. Freewat 0.4 was launched as a beta version and publicly available upon registration from this website: http://freewat.eu/. Most of the developers are italian and the project is funded under the H2020 program from the European Union and the Regione Toscana. The software comes with clear and descriptive documentation and tutorials plus the installation instructions. 
This article show the most important features of Freewat and its capabilities for representing the geospatially referenced regional groundwater flow.

Read More

8 keys to develop a Thesis in Distributed Hydrological Modeling

You have finished your undergraduate/postgraduate studies in water resources and want to make a good research thesis? If this is the case, you have several alternatives: research about groundwater, superficial water, floods, inundation areas, flow/ecosystem interaction, even water supply systems. All these areas have specific applied software to evaluate and simulate the actual and future water requirements.
Read More